| __timestamp | Cisco Systems, Inc. | Wipro Limited |
|---|---|---|
| Wednesday, January 1, 2014 | 19373000000 | 321284000000 |
| Thursday, January 1, 2015 | 19480000000 | 356724000000 |
| Friday, January 1, 2016 | 18287000000 | 391544000000 |
| Sunday, January 1, 2017 | 17781000000 | 385575000000 |
| Monday, January 1, 2018 | 18724000000 | 413033000000 |
| Tuesday, January 1, 2019 | 19238000000 | 436085000000 |
| Wednesday, January 1, 2020 | 17618000000 | 423205000000 |
| Friday, January 1, 2021 | 17924000000 | 555872000000 |
| Saturday, January 1, 2022 | 19309000000 | 645446000000 |
| Sunday, January 1, 2023 | 21245000000 | 631497000000 |
| Monday, January 1, 2024 | 18975000000 | 631497000000 |
Unveiling the hidden dimensions of data
In the ever-evolving landscape of global technology, Cisco Systems, Inc. and Wipro Limited stand as titans, each with a unique trajectory in cost management. From 2014 to 2024, Cisco's cost of revenue has shown a modest fluctuation, peaking in 2023 with a 10% increase from its 2014 baseline. In contrast, Wipro's cost of revenue has surged by nearly 97% over the same period, reflecting its aggressive expansion and scaling strategies.
Cisco's cost efficiency is evident, maintaining a relatively stable trend with minor dips, such as in 2020. Meanwhile, Wipro's upward trajectory highlights its robust growth in the IT services sector, especially notable in 2022 with a 52% rise from 2017. This comparison not only underscores the strategic differences between these two industry leaders but also offers insights into their operational priorities and market positioning.
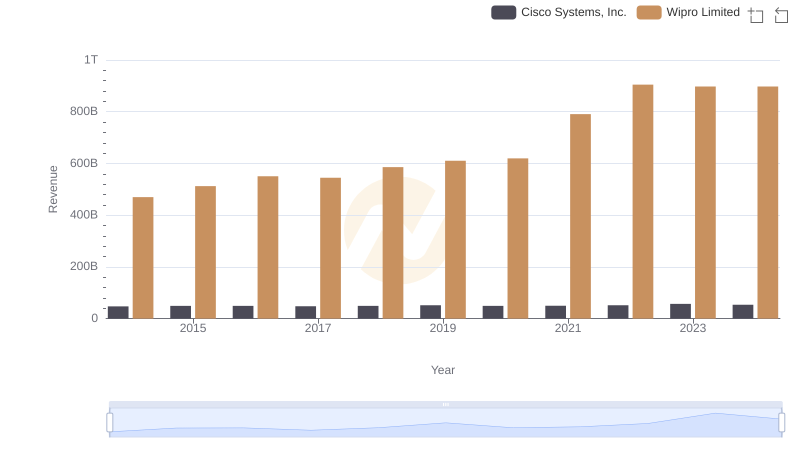
Revenue Insights: Cisco Systems, Inc. and Wipro Limited Performance Compared
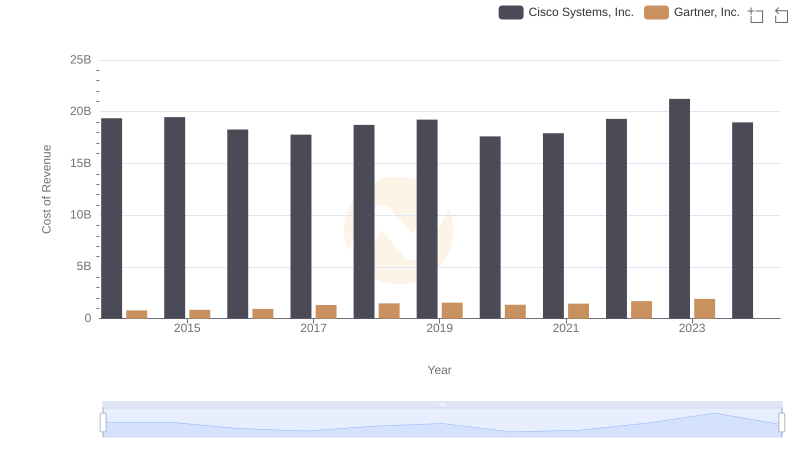
Cost of Revenue: Key Insights for Cisco Systems, Inc. and Gartner, Inc.
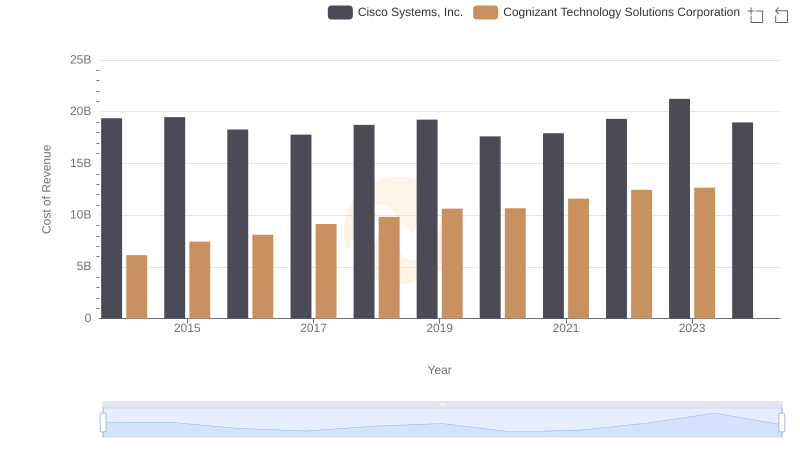
Analyzing Cost of Revenue: Cisco Systems, Inc. and Cognizant Technology Solutions Corporation
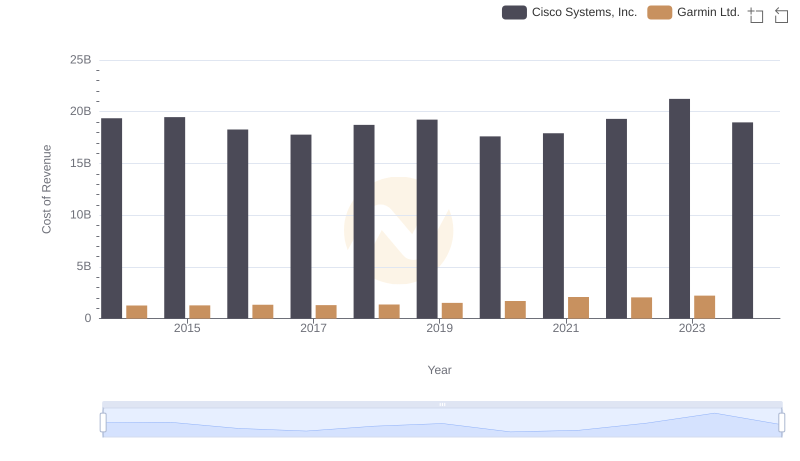
Cost of Revenue Trends: Cisco Systems, Inc. vs Garmin Ltd.
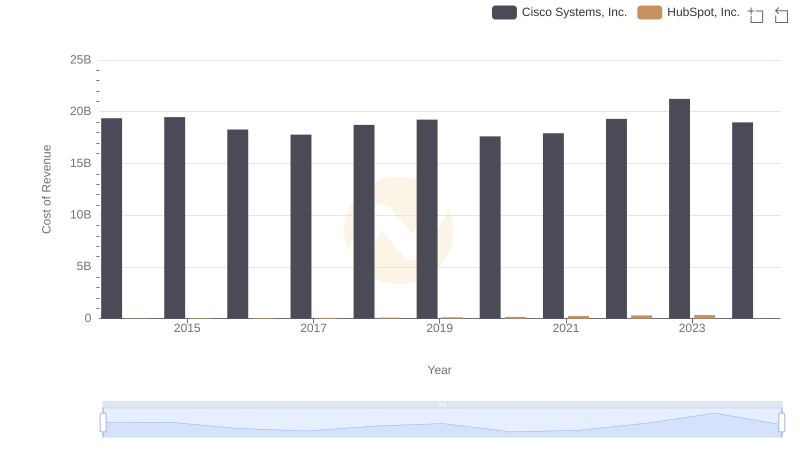
Cisco Systems, Inc. vs HubSpot, Inc.: Efficiency in Cost of Revenue Explored
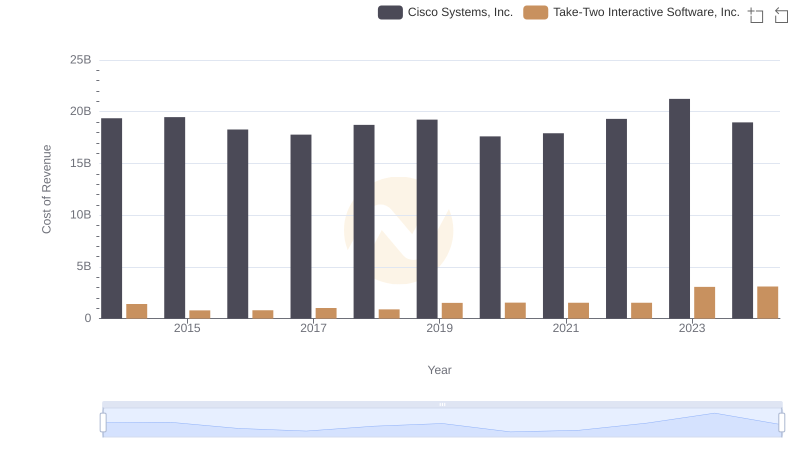
Cisco Systems, Inc. vs Take-Two Interactive Software, Inc.: Efficiency in Cost of Revenue Explored
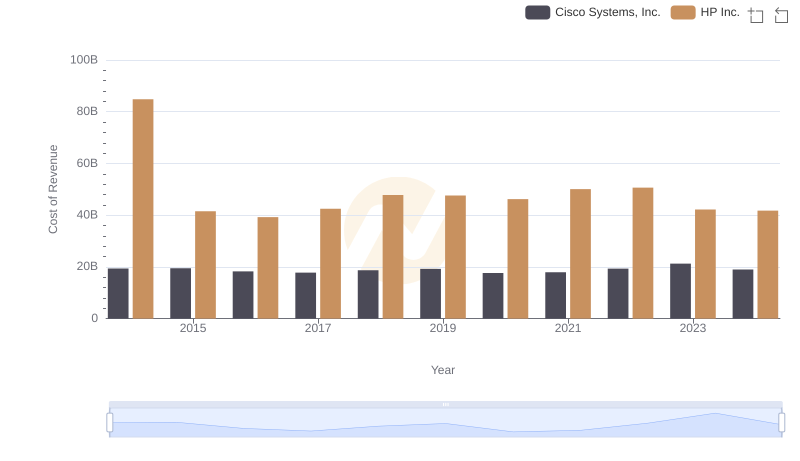
Cost of Revenue: Key Insights for Cisco Systems, Inc. and HP Inc.
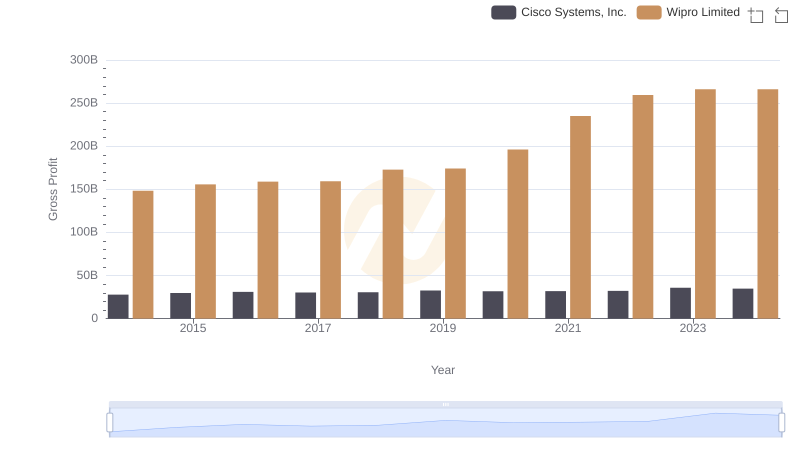
Gross Profit Analysis: Comparing Cisco Systems, Inc. and Wipro Limited
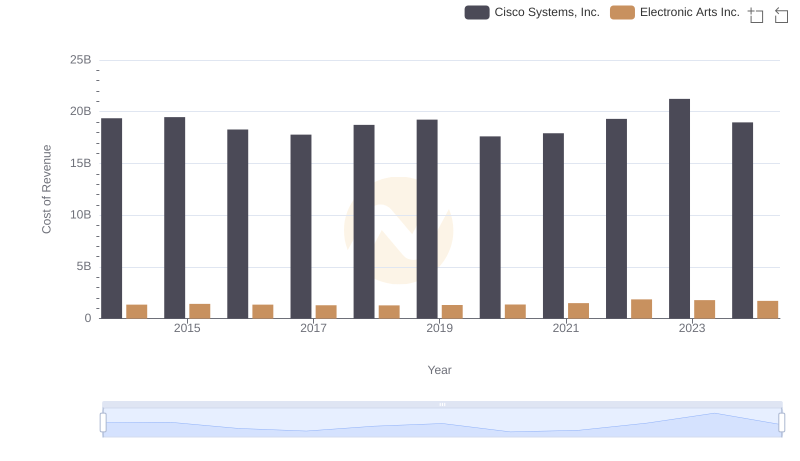
Cost of Revenue: Key Insights for Cisco Systems, Inc. and Electronic Arts Inc.

Analyzing Cost of Revenue: Cisco Systems, Inc. and Microchip Technology Incorporated
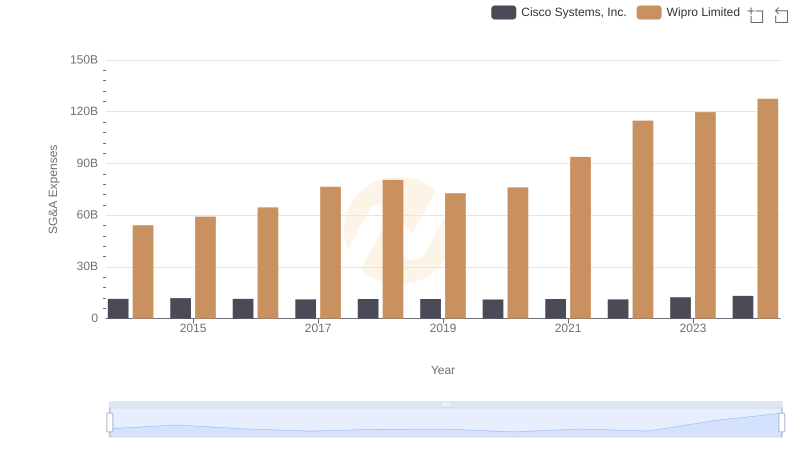
Breaking Down SG&A Expenses: Cisco Systems, Inc. vs Wipro Limited

Cisco Systems, Inc. and Wipro Limited: A Detailed Examination of EBITDA Performance