| __timestamp | Cisco Systems, Inc. | Cognizant Technology Solutions Corporation |
|---|---|---|
| Wednesday, January 1, 2014 | 12709000000 | 2093000000 |
| Thursday, January 1, 2015 | 14209000000 | 2472000000 |
| Friday, January 1, 2016 | 15678000000 | 2668000000 |
| Sunday, January 1, 2017 | 15383000000 | 3040000000 |
| Monday, January 1, 2018 | 16172000000 | 3322000000 |
| Tuesday, January 1, 2019 | 17334000000 | 3095000000 |
| Wednesday, January 1, 2020 | 16363000000 | 2679000000 |
| Friday, January 1, 2021 | 15558000000 | 3410000000 |
| Saturday, January 1, 2022 | 16794000000 | 3604000000 |
| Sunday, January 1, 2023 | 17471000000 | 3347000000 |
| Monday, January 1, 2024 | 15747000000 | 3534000000 |
In pursuit of knowledge
In the ever-evolving tech industry, Cisco Systems, Inc. and Cognizant Technology Solutions Corporation have been pivotal players. From 2014 to 2023, Cisco's EBITDA has shown a robust upward trend, peaking at approximately $17.5 billion in 2023, marking a 37% increase from 2014. In contrast, Cognizant's EBITDA, while growing, has been more modest, reaching around $3.3 billion in 2023, a 60% rise from its 2014 figures. This comparison highlights Cisco's dominant financial performance, consistently outperforming Cognizant by a factor of five. However, Cognizant's growth rate is noteworthy, reflecting its strategic adaptations in a competitive market. The data for 2024 is incomplete, indicating potential shifts in the coming year. This analysis underscores the dynamic nature of the tech sector, where strategic decisions and market conditions continuously shape financial outcomes.
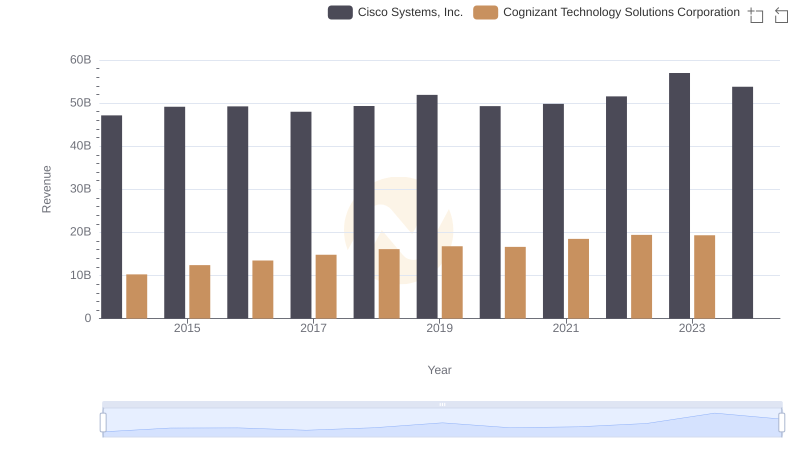
Cisco Systems, Inc. vs Cognizant Technology Solutions Corporation: Annual Revenue Growth Compared
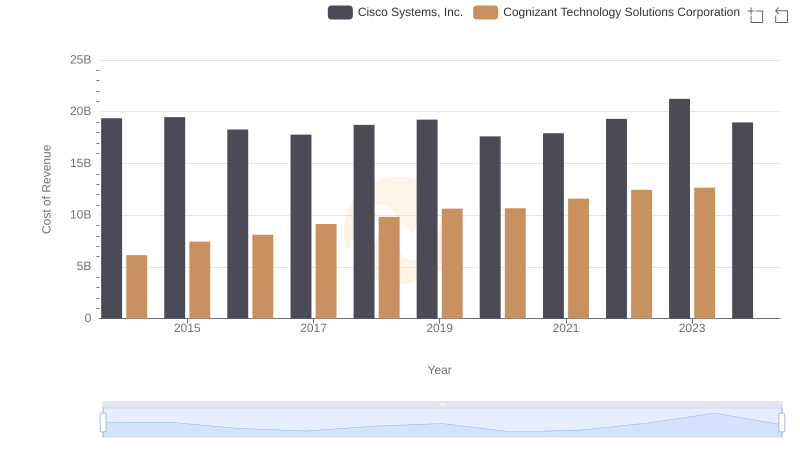
Analyzing Cost of Revenue: Cisco Systems, Inc. and Cognizant Technology Solutions Corporation

Cisco Systems, Inc. and Cognizant Technology Solutions Corporation: A Detailed Gross Profit Analysis
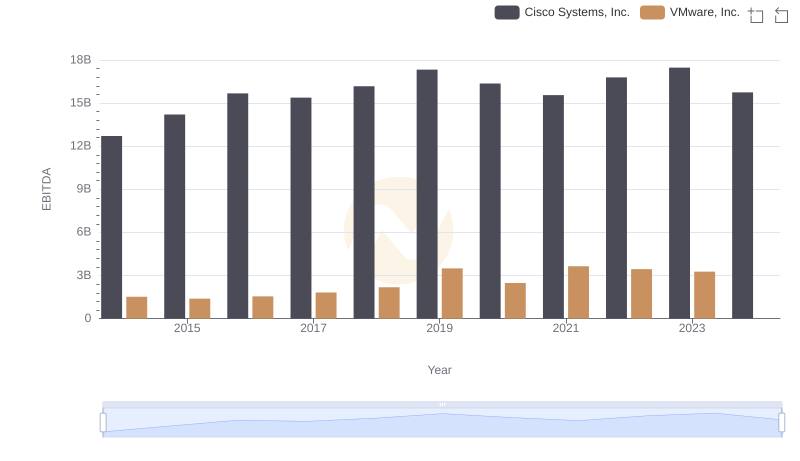
Cisco Systems, Inc. and VMware, Inc.: A Detailed Examination of EBITDA Performance
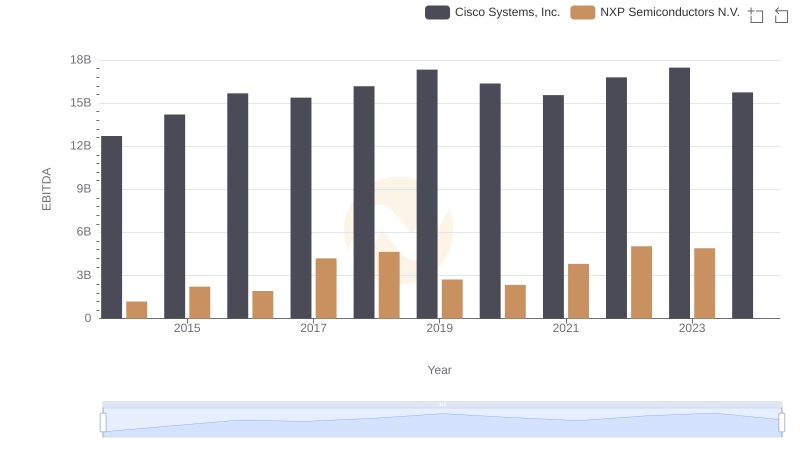
Comparative EBITDA Analysis: Cisco Systems, Inc. vs NXP Semiconductors N.V.
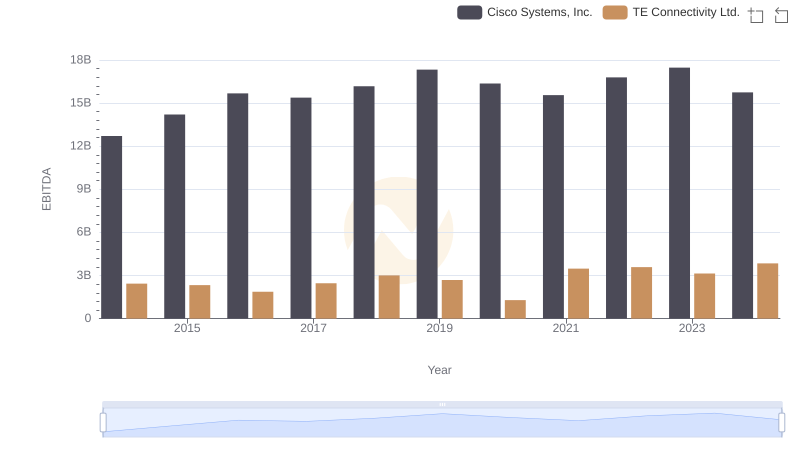
Professional EBITDA Benchmarking: Cisco Systems, Inc. vs TE Connectivity Ltd.
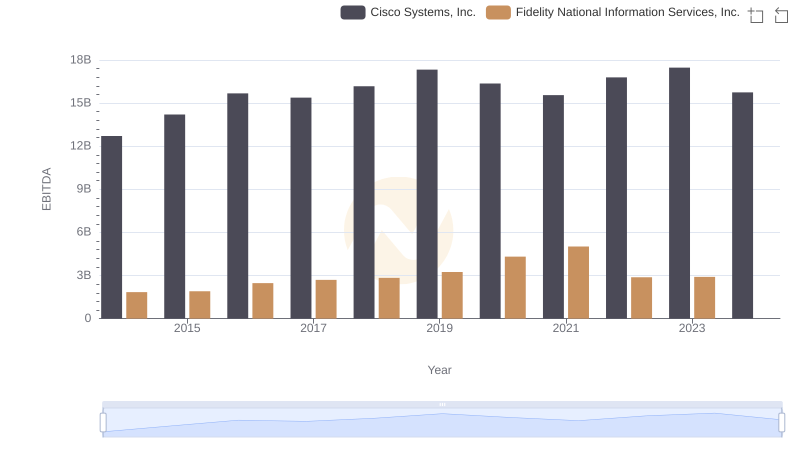
Comprehensive EBITDA Comparison: Cisco Systems, Inc. vs Fidelity National Information Services, Inc.
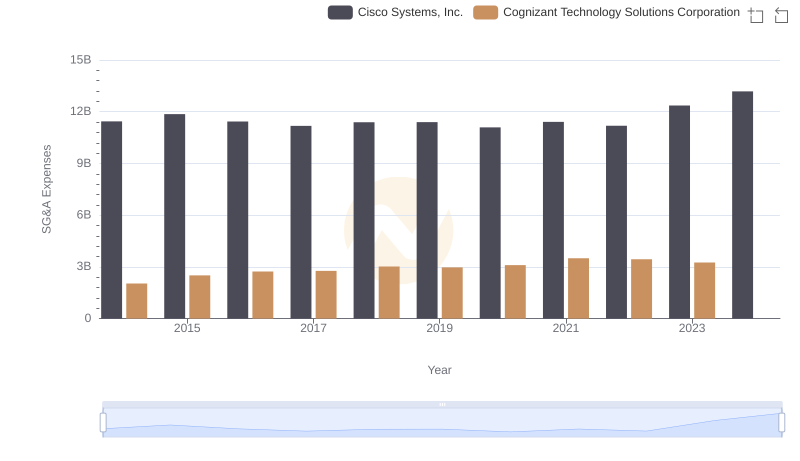
Cisco Systems, Inc. and Cognizant Technology Solutions Corporation: SG&A Spending Patterns Compared
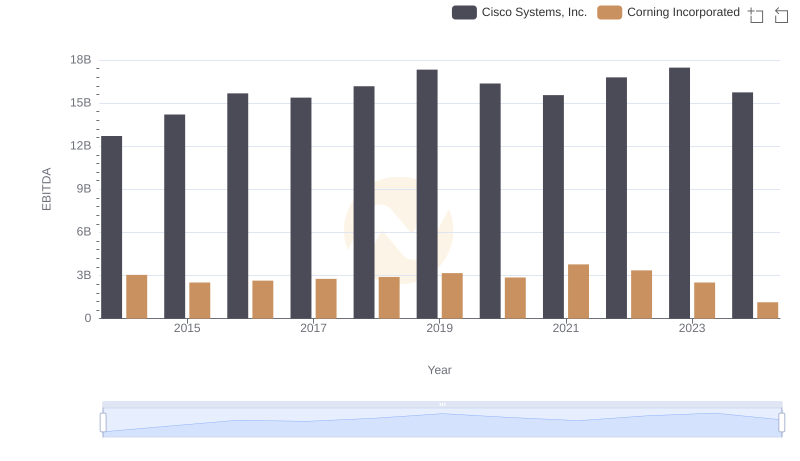
Cisco Systems, Inc. vs Corning Incorporated: In-Depth EBITDA Performance Comparison
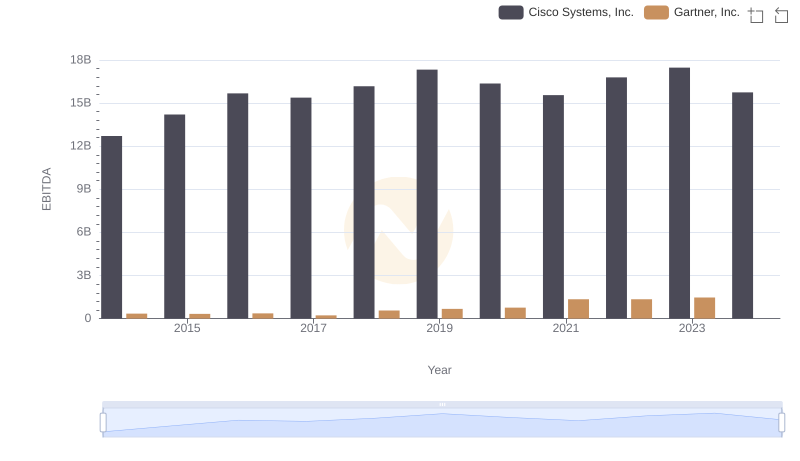
EBITDA Performance Review: Cisco Systems, Inc. vs Gartner, Inc.
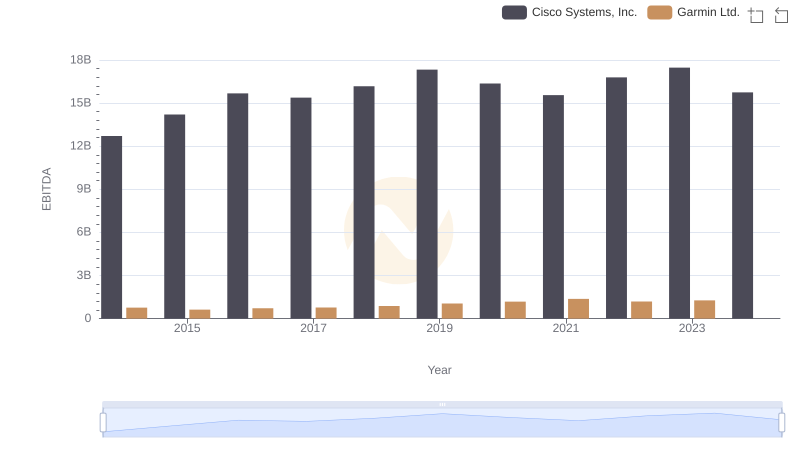
A Side-by-Side Analysis of EBITDA: Cisco Systems, Inc. and Garmin Ltd.

Cisco Systems, Inc. and Wipro Limited: A Detailed Examination of EBITDA Performance