| __timestamp | Cisco Systems, Inc. | Wipro Limited |
|---|---|---|
| Wednesday, January 1, 2014 | 11437000000 | 54144000000 |
| Thursday, January 1, 2015 | 11861000000 | 59142000000 |
| Friday, January 1, 2016 | 11433000000 | 64514000000 |
| Sunday, January 1, 2017 | 11177000000 | 76490000000 |
| Monday, January 1, 2018 | 11386000000 | 80461000000 |
| Tuesday, January 1, 2019 | 11398000000 | 72730000000 |
| Wednesday, January 1, 2020 | 11094000000 | 76086000000 |
| Friday, January 1, 2021 | 11411000000 | 93805000000 |
| Saturday, January 1, 2022 | 11186000000 | 114803000000 |
| Sunday, January 1, 2023 | 12358000000 | 119755000000 |
| Monday, January 1, 2024 | 13177000000 | 127509000000 |
Unleashing the power of data
In the ever-evolving tech industry, understanding the financial strategies of giants like Cisco Systems, Inc. and Wipro Limited is crucial. Over the past decade, from 2014 to 2024, these companies have shown distinct trends in their Selling, General, and Administrative (SG&A) expenses. Cisco's SG&A expenses have remained relatively stable, with a slight increase of about 15% from 2014 to 2024. In contrast, Wipro's expenses have surged by over 135% during the same period, reflecting a more aggressive expansion strategy.
This divergence highlights the different operational approaches of these two tech behemoths. While Cisco maintains a steady course, Wipro's significant rise in SG&A expenses suggests a focus on scaling and market penetration. As the tech landscape continues to shift, these financial strategies will play a pivotal role in shaping the future trajectories of both companies.
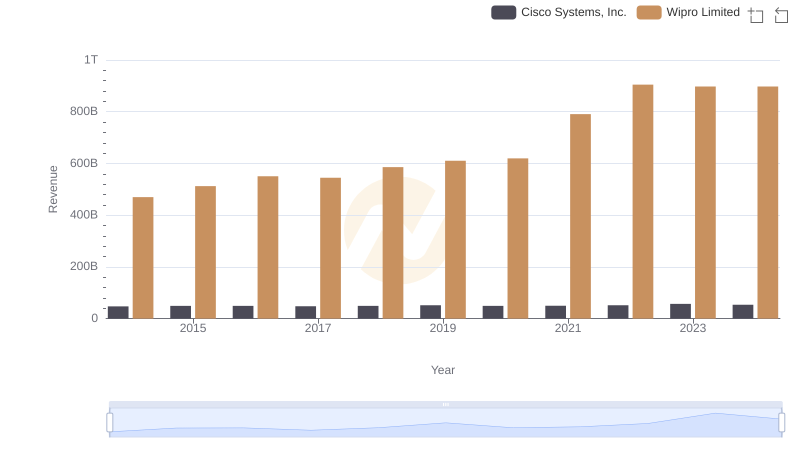
Revenue Insights: Cisco Systems, Inc. and Wipro Limited Performance Compared
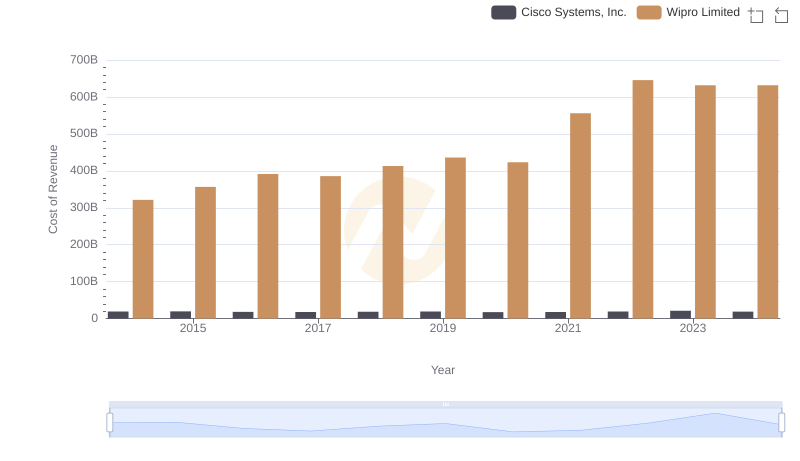
Cost of Revenue Trends: Cisco Systems, Inc. vs Wipro Limited
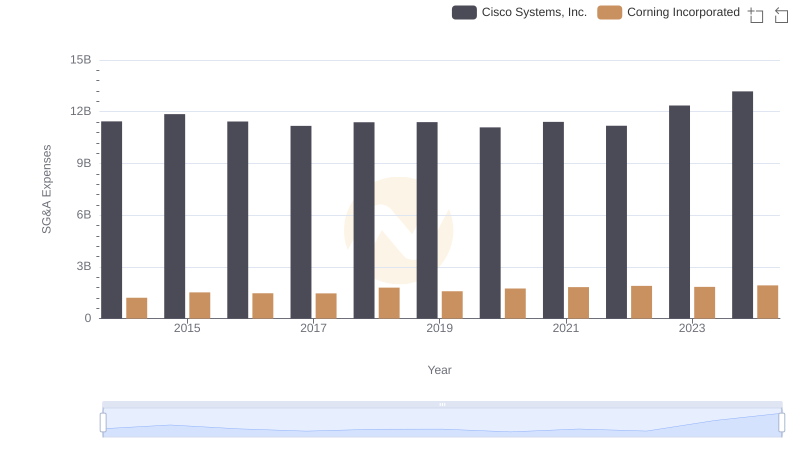
Cisco Systems, Inc. or Corning Incorporated: Who Manages SG&A Costs Better?
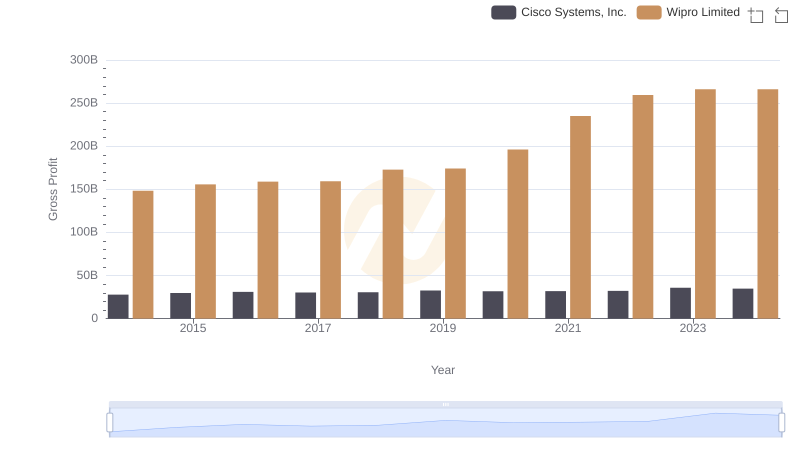
Gross Profit Analysis: Comparing Cisco Systems, Inc. and Wipro Limited
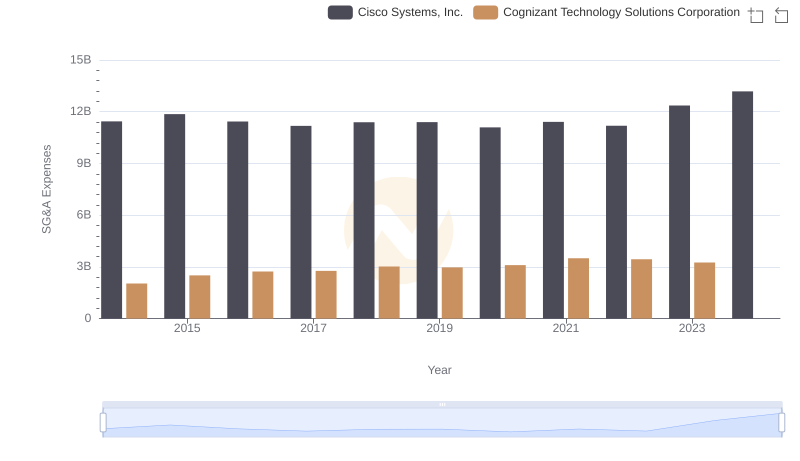
Cisco Systems, Inc. and Cognizant Technology Solutions Corporation: SG&A Spending Patterns Compared

Operational Costs Compared: SG&A Analysis of Cisco Systems, Inc. and Gartner, Inc.

Cost Management Insights: SG&A Expenses for Cisco Systems, Inc. and HubSpot, Inc.

Cost Management Insights: SG&A Expenses for Cisco Systems, Inc. and Garmin Ltd.
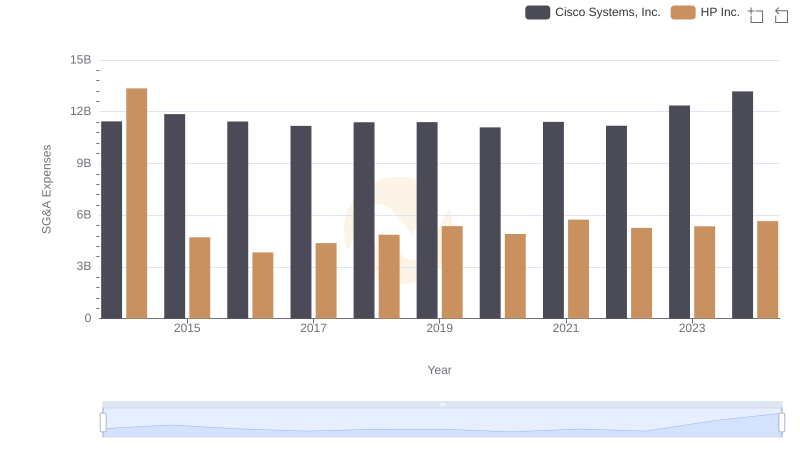
Breaking Down SG&A Expenses: Cisco Systems, Inc. vs HP Inc.

Cisco Systems, Inc. and Wipro Limited: A Detailed Examination of EBITDA Performance
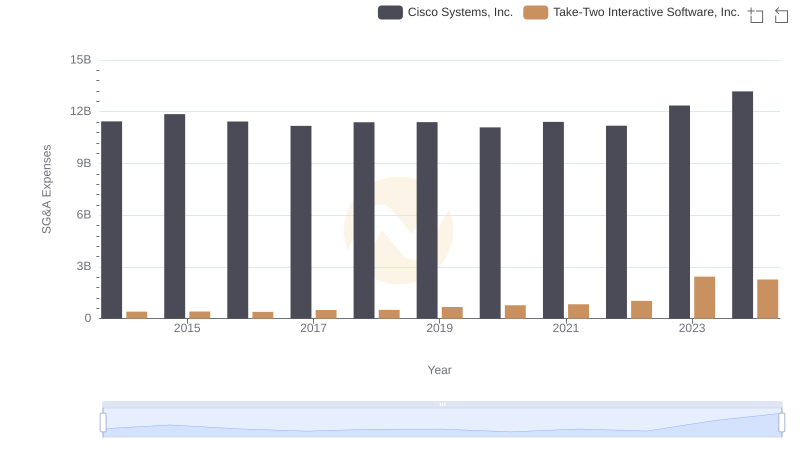
Who Optimizes SG&A Costs Better? Cisco Systems, Inc. or Take-Two Interactive Software, Inc.
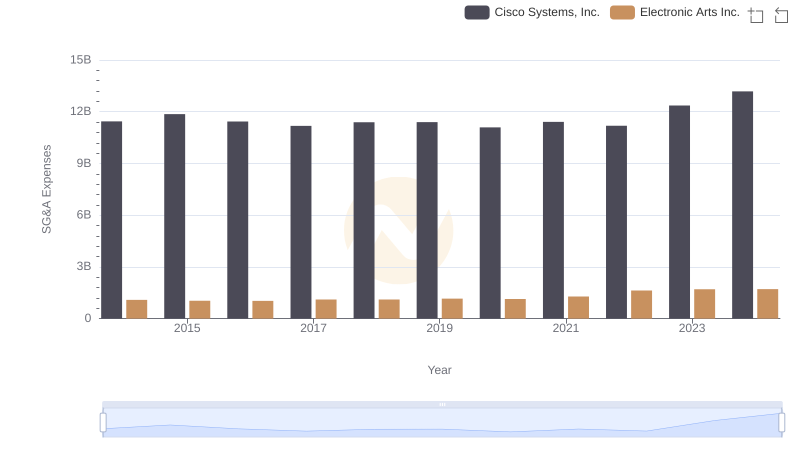
Who Optimizes SG&A Costs Better? Cisco Systems, Inc. or Electronic Arts Inc.