| __timestamp | Cisco Systems, Inc. | Cognizant Technology Solutions Corporation |
|---|---|---|
| Wednesday, January 1, 2014 | 11437000000 | 2037021000 |
| Thursday, January 1, 2015 | 11861000000 | 2508600000 |
| Friday, January 1, 2016 | 11433000000 | 2731000000 |
| Sunday, January 1, 2017 | 11177000000 | 2769000000 |
| Monday, January 1, 2018 | 11386000000 | 3026000000 |
| Tuesday, January 1, 2019 | 11398000000 | 2972000000 |
| Wednesday, January 1, 2020 | 11094000000 | 3100000000 |
| Friday, January 1, 2021 | 11411000000 | 3503000000 |
| Saturday, January 1, 2022 | 11186000000 | 3443000000 |
| Sunday, January 1, 2023 | 12358000000 | 3252000000 |
| Monday, January 1, 2024 | 13177000000 | 3223000000 |
Cracking the code
In the ever-evolving tech landscape, understanding the financial strategies of industry leaders is crucial. Cisco Systems, Inc. and Cognizant Technology Solutions Corporation, two titans in the tech world, have shown distinct patterns in their Selling, General, and Administrative (SG&A) expenses over the past decade. From 2014 to 2023, Cisco's SG&A expenses have seen a steady increase, peaking at approximately 13% higher in 2023 compared to 2014. In contrast, Cognizant's SG&A expenses have grown by about 60% over the same period, reflecting a more aggressive expansion strategy.
Interestingly, while Cisco's expenses remained relatively stable, Cognizant's spending surged, particularly between 2018 and 2021, indicating a strategic push during those years. However, data for 2024 is missing for Cognizant, leaving room for speculation on their future financial maneuvers. These insights offer a glimpse into how these companies prioritize operational efficiency and growth.
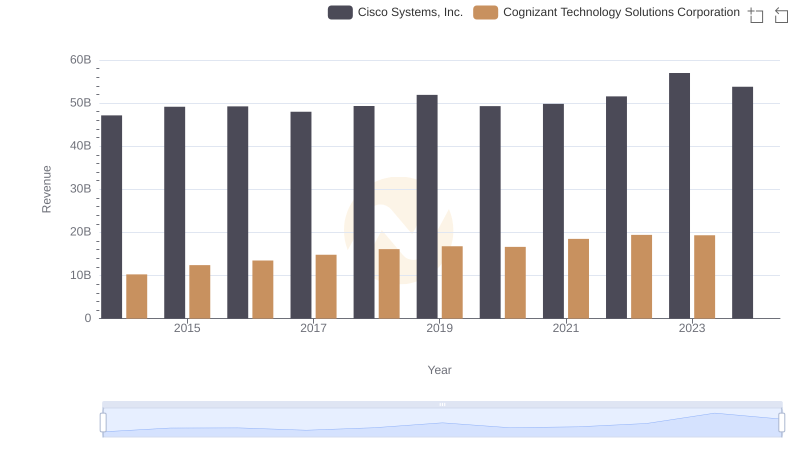
Cisco Systems, Inc. vs Cognizant Technology Solutions Corporation: Annual Revenue Growth Compared
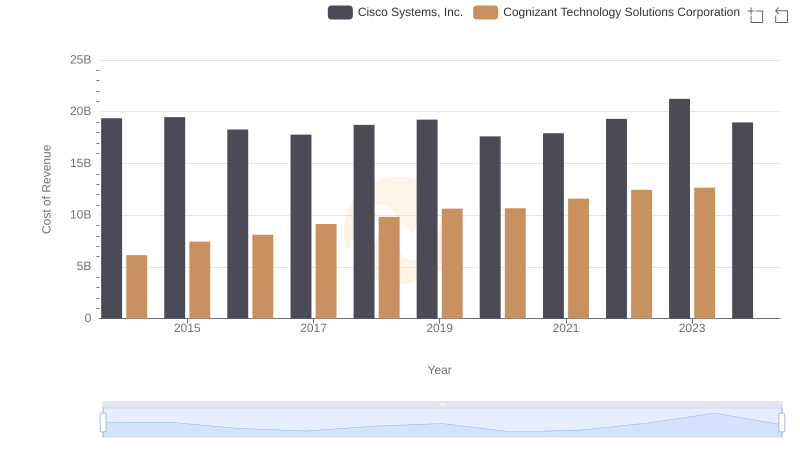
Analyzing Cost of Revenue: Cisco Systems, Inc. and Cognizant Technology Solutions Corporation
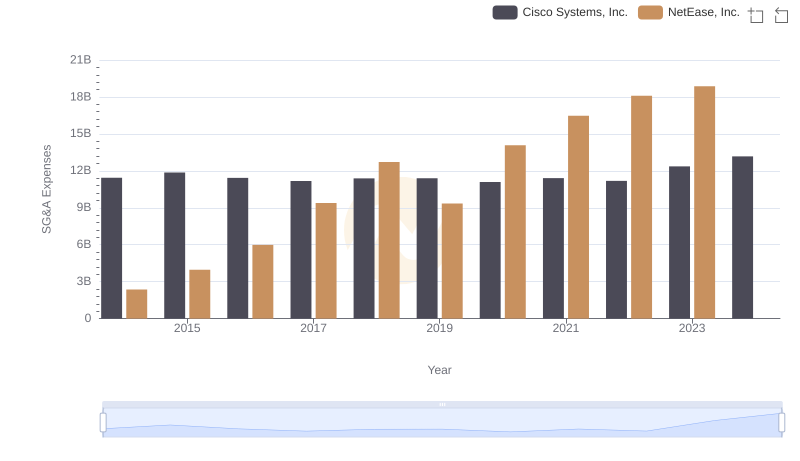
Selling, General, and Administrative Costs: Cisco Systems, Inc. vs NetEase, Inc.
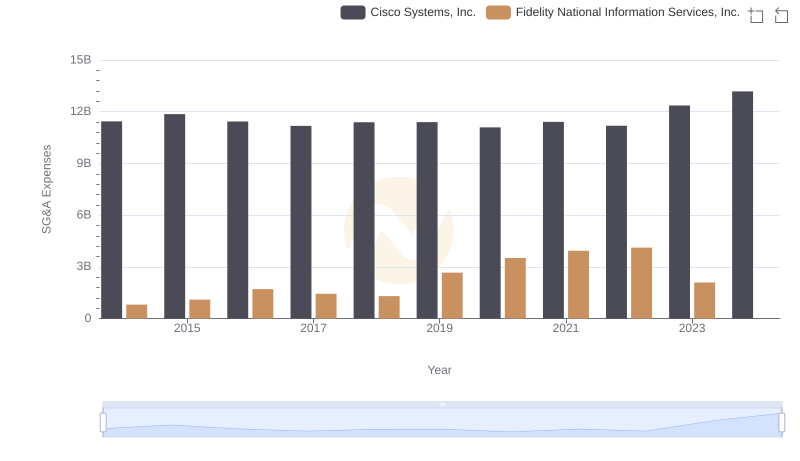
Breaking Down SG&A Expenses: Cisco Systems, Inc. vs Fidelity National Information Services, Inc.

Cisco Systems, Inc. and Cognizant Technology Solutions Corporation: A Detailed Gross Profit Analysis
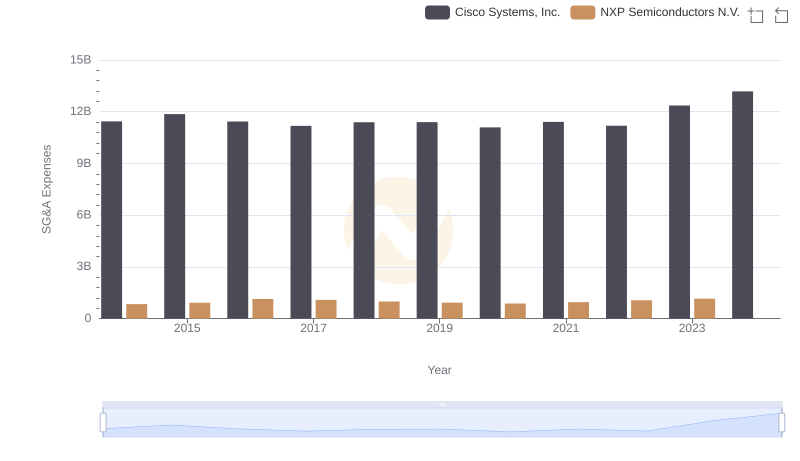
Cisco Systems, Inc. or NXP Semiconductors N.V.: Who Manages SG&A Costs Better?
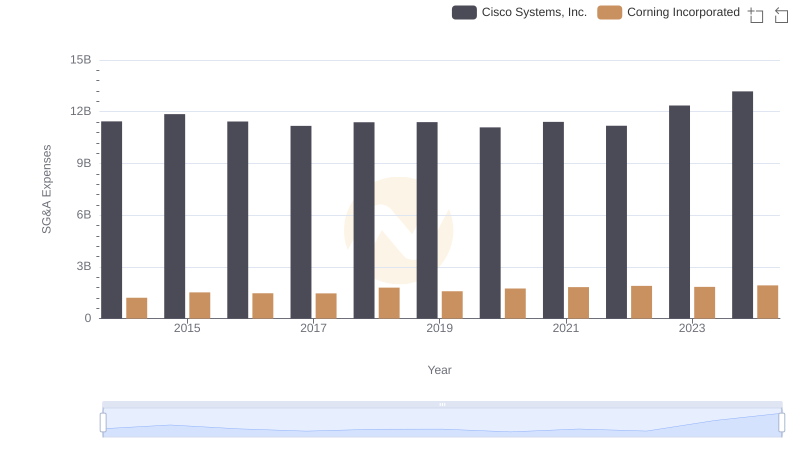
Cisco Systems, Inc. or Corning Incorporated: Who Manages SG&A Costs Better?

Operational Costs Compared: SG&A Analysis of Cisco Systems, Inc. and Gartner, Inc.
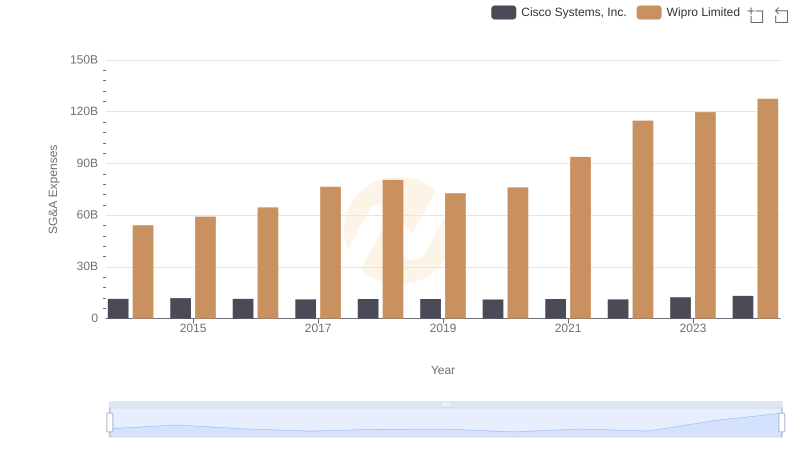
Breaking Down SG&A Expenses: Cisco Systems, Inc. vs Wipro Limited

Cisco Systems, Inc. vs Cognizant Technology Solutions Corporation: In-Depth EBITDA Performance Comparison

Cost Management Insights: SG&A Expenses for Cisco Systems, Inc. and HubSpot, Inc.

Cost Management Insights: SG&A Expenses for Cisco Systems, Inc. and Garmin Ltd.