| __timestamp | Cisco Systems, Inc. | Gartner, Inc. |
|---|---|---|
| Wednesday, January 1, 2014 | 11437000000 | 876067000 |
| Thursday, January 1, 2015 | 11861000000 | 962677000 |
| Friday, January 1, 2016 | 11433000000 | 1089184000 |
| Sunday, January 1, 2017 | 11177000000 | 1599004000 |
| Monday, January 1, 2018 | 11386000000 | 1884141000 |
| Tuesday, January 1, 2019 | 11398000000 | 2103424000 |
| Wednesday, January 1, 2020 | 11094000000 | 2039087000 |
| Friday, January 1, 2021 | 11411000000 | 2155724000 |
| Saturday, January 1, 2022 | 11186000000 | 2480846000 |
| Sunday, January 1, 2023 | 12358000000 | 2701542000 |
| Monday, January 1, 2024 | 13177000000 | 2884814000 |
Cracking the code
In the ever-evolving tech industry, operational efficiency is key to maintaining a competitive edge. This analysis delves into the Selling, General, and Administrative (SG&A) expenses of two industry giants: Cisco Systems, Inc. and Gartner, Inc., from 2014 to 2023. Over this decade, Cisco's SG&A expenses have shown a steady increase, peaking at approximately $13.2 billion in 2023, marking a 15% rise from 2014. In contrast, Gartner's expenses have surged by over 200%, reaching around $2.7 billion in 2023. This stark difference highlights Cisco's consistent operational scale, while Gartner's rapid growth reflects its expanding market influence. Notably, data for 2024 is incomplete, indicating potential shifts in future trends. This financial insight underscores the strategic priorities of these companies, offering a window into their operational strategies and market positioning.
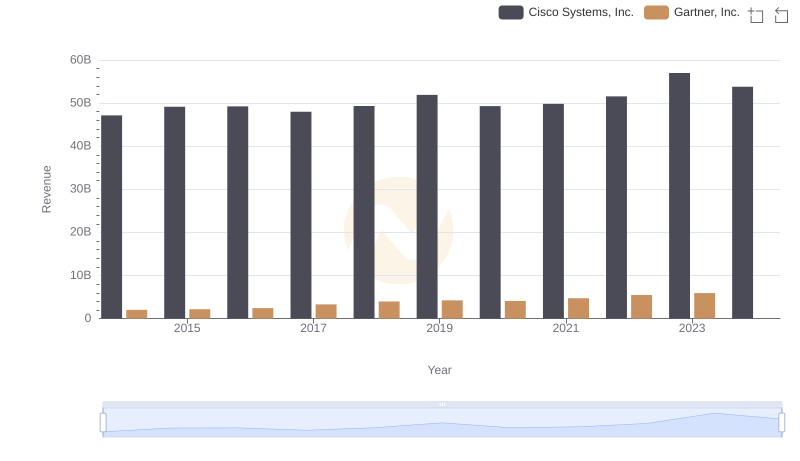
Comparing Revenue Performance: Cisco Systems, Inc. or Gartner, Inc.?
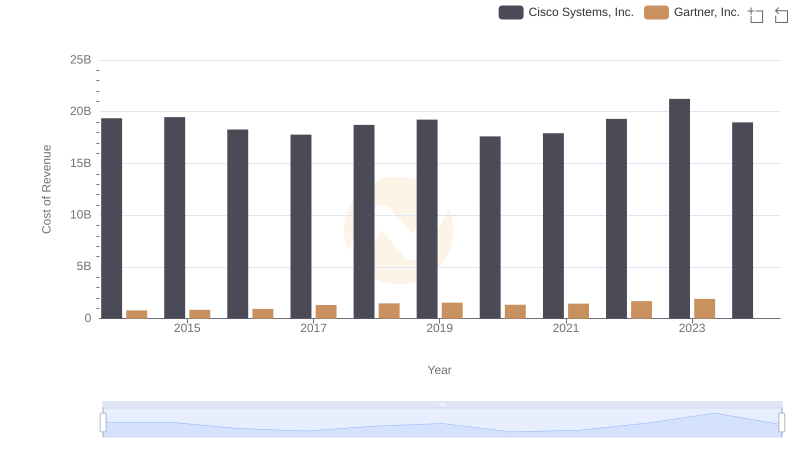
Cost of Revenue: Key Insights for Cisco Systems, Inc. and Gartner, Inc.
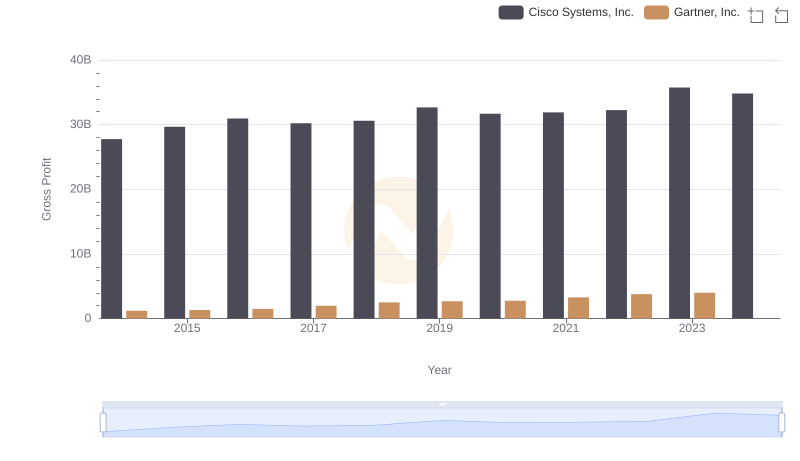
Cisco Systems, Inc. and Gartner, Inc.: A Detailed Gross Profit Analysis
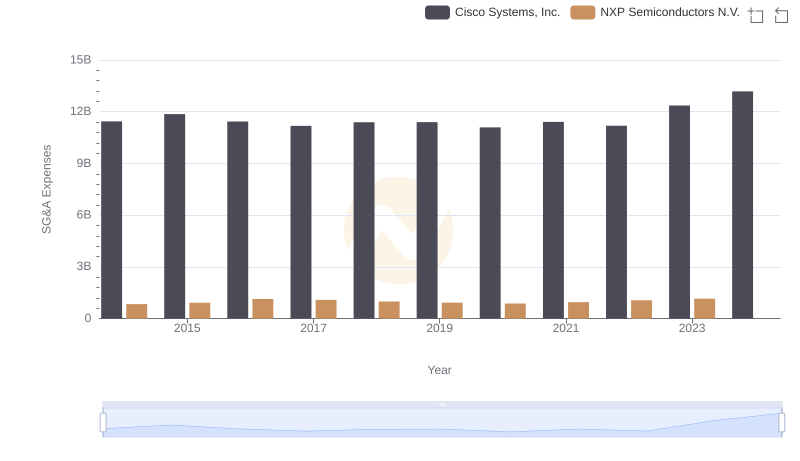
Cisco Systems, Inc. or NXP Semiconductors N.V.: Who Manages SG&A Costs Better?
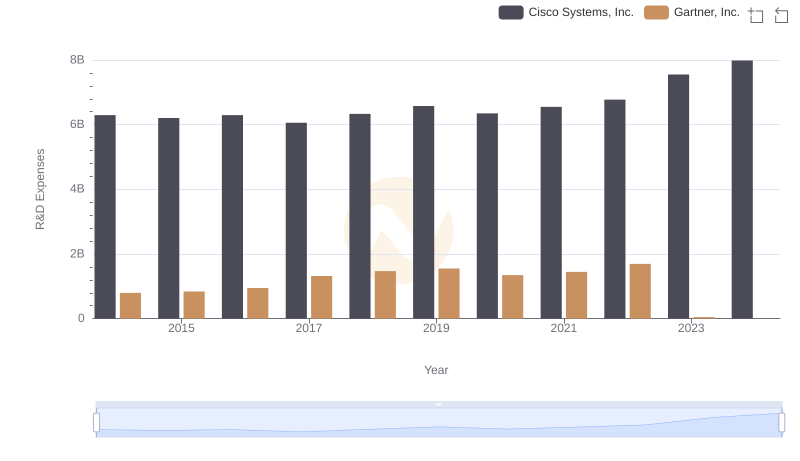
Cisco Systems, Inc. vs Gartner, Inc.: Strategic Focus on R&D Spending
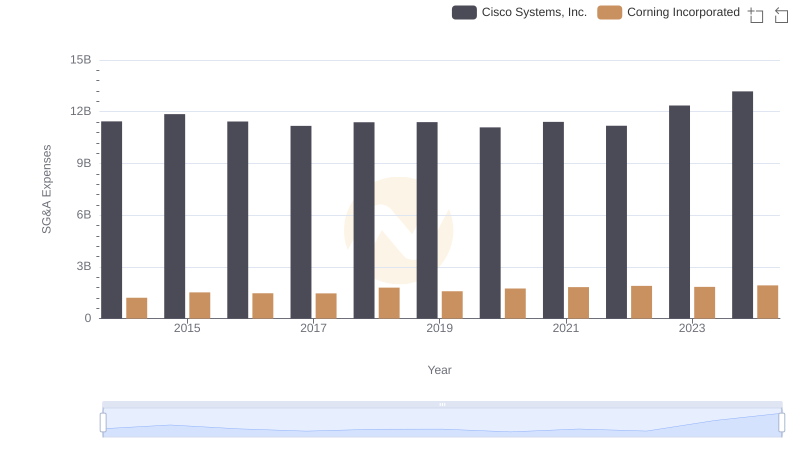
Cisco Systems, Inc. or Corning Incorporated: Who Manages SG&A Costs Better?
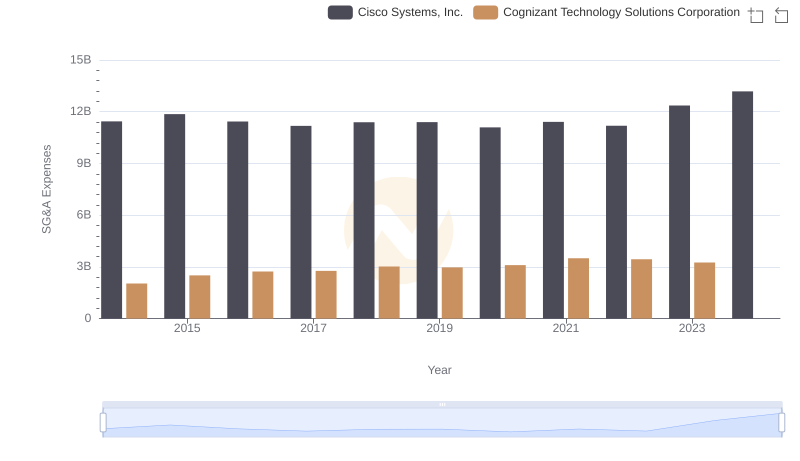
Cisco Systems, Inc. and Cognizant Technology Solutions Corporation: SG&A Spending Patterns Compared
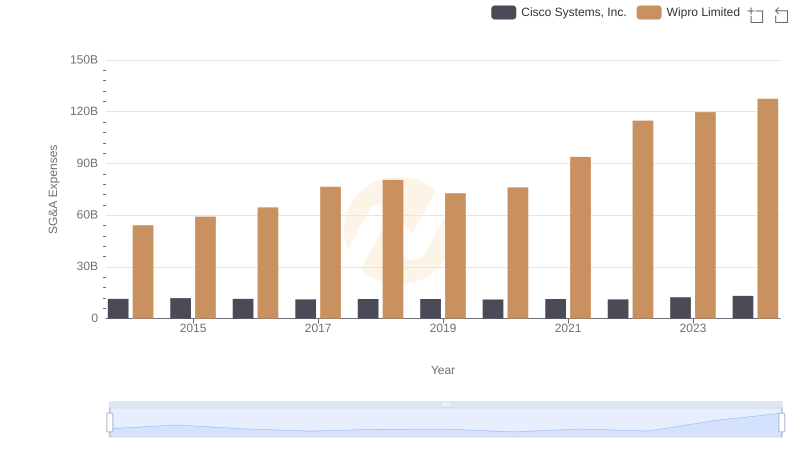
Breaking Down SG&A Expenses: Cisco Systems, Inc. vs Wipro Limited
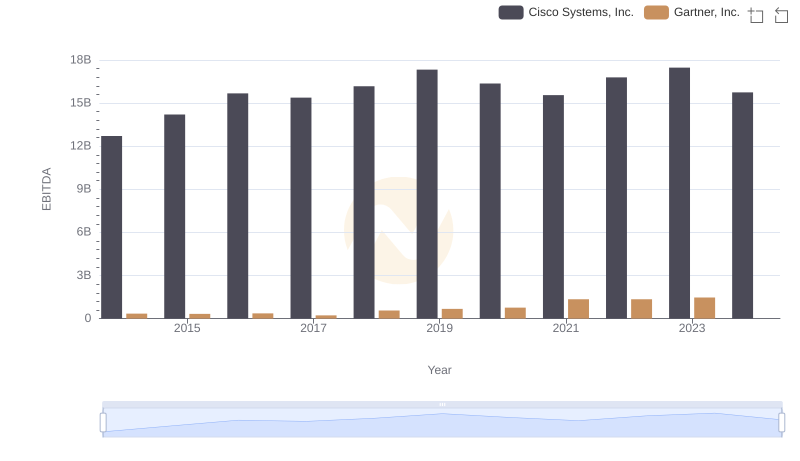
EBITDA Performance Review: Cisco Systems, Inc. vs Gartner, Inc.

Cost Management Insights: SG&A Expenses for Cisco Systems, Inc. and HubSpot, Inc.

Cost Management Insights: SG&A Expenses for Cisco Systems, Inc. and Garmin Ltd.
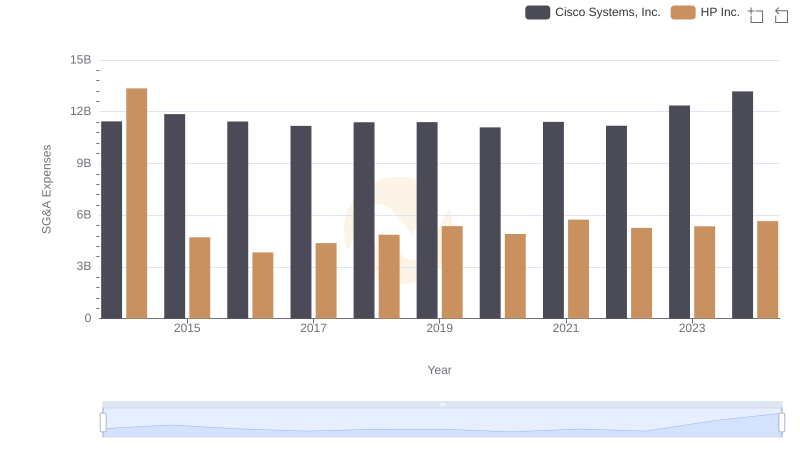
Breaking Down SG&A Expenses: Cisco Systems, Inc. vs HP Inc.