| __timestamp | Cisco Systems, Inc. | Fidelity National Information Services, Inc. |
|---|---|---|
| Wednesday, January 1, 2014 | 11437000000 | 810500000 |
| Thursday, January 1, 2015 | 11861000000 | 1102800000 |
| Friday, January 1, 2016 | 11433000000 | 1710000000 |
| Sunday, January 1, 2017 | 11177000000 | 1442000000 |
| Monday, January 1, 2018 | 11386000000 | 1301000000 |
| Tuesday, January 1, 2019 | 11398000000 | 2667000000 |
| Wednesday, January 1, 2020 | 11094000000 | 3516000000 |
| Friday, January 1, 2021 | 11411000000 | 3938000000 |
| Saturday, January 1, 2022 | 11186000000 | 4118000000 |
| Sunday, January 1, 2023 | 12358000000 | 2096000000 |
| Monday, January 1, 2024 | 13177000000 | 2185000000 |
Igniting the spark of knowledge
In the ever-evolving tech landscape, understanding operational efficiency is crucial. Cisco Systems, Inc. and Fidelity National Information Services, Inc. offer a fascinating study in contrasts when it comes to Selling, General, and Administrative (SG&A) expenses. From 2014 to 2023, Cisco's SG&A expenses have shown a steady trend, peaking in 2024 with a 15% increase from 2014. In contrast, Fidelity National's expenses surged by over 400% from 2014 to 2022, reflecting its aggressive expansion strategy. However, 2023 saw a significant drop, indicating potential strategic shifts or cost optimizations. This data highlights the differing approaches of a tech giant and a financial services leader in managing operational costs. As businesses navigate the complexities of the digital age, these insights provide valuable lessons in balancing growth with efficiency.
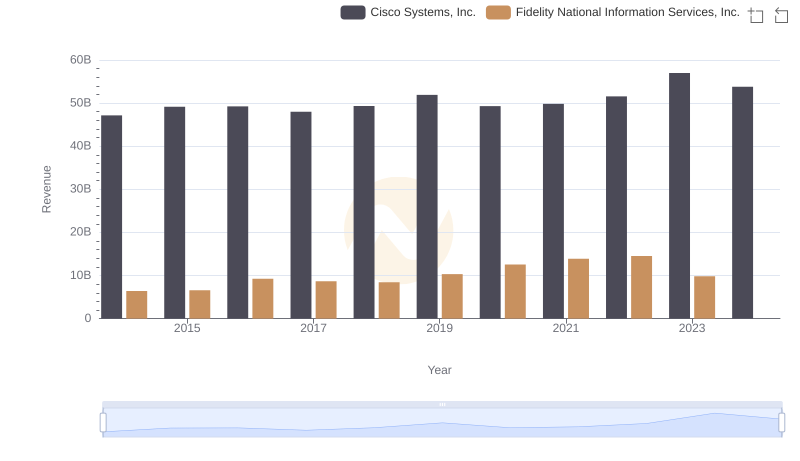
Cisco Systems, Inc. or Fidelity National Information Services, Inc.: Who Leads in Yearly Revenue?

Cost of Revenue Comparison: Cisco Systems, Inc. vs Fidelity National Information Services, Inc.
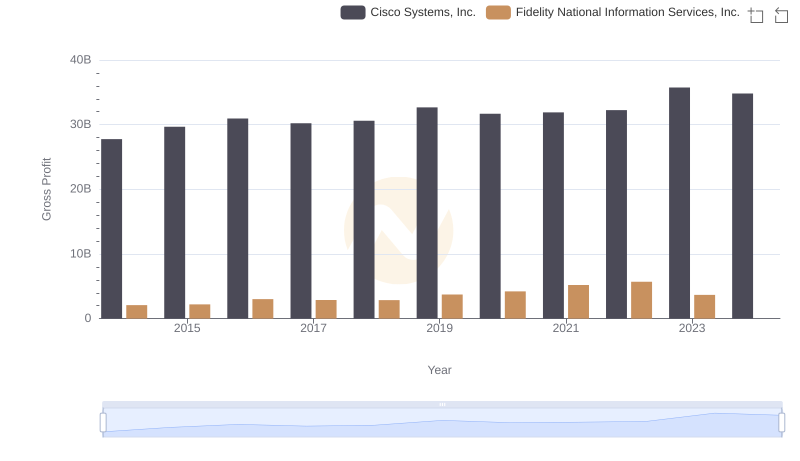
Cisco Systems, Inc. and Fidelity National Information Services, Inc.: A Detailed Gross Profit Analysis
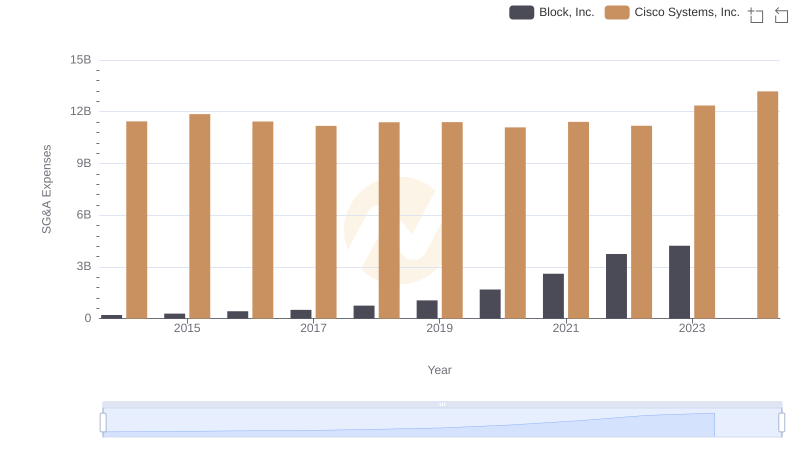
SG&A Efficiency Analysis: Comparing Cisco Systems, Inc. and Block, Inc.
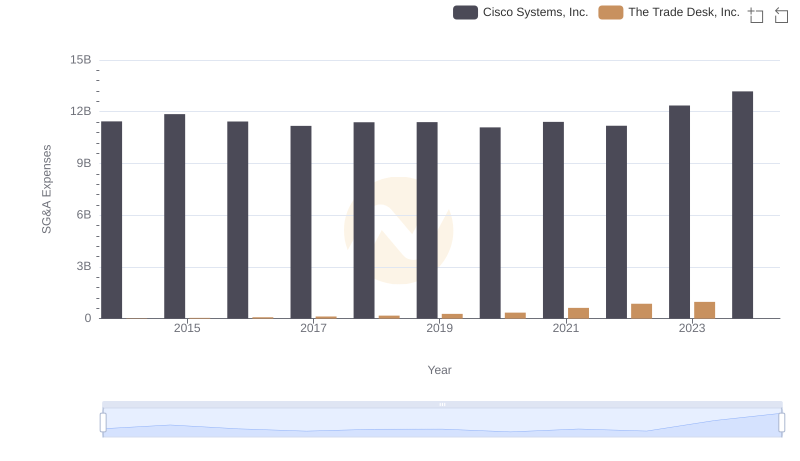
Cost Management Insights: SG&A Expenses for Cisco Systems, Inc. and The Trade Desk, Inc.
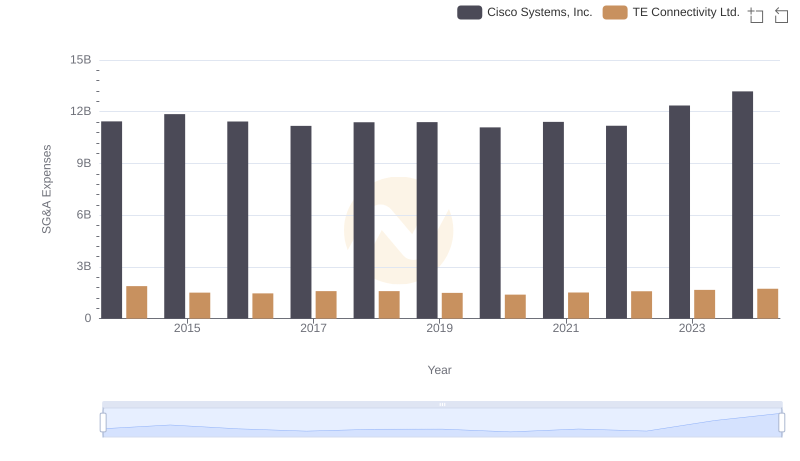
Who Optimizes SG&A Costs Better? Cisco Systems, Inc. or TE Connectivity Ltd.
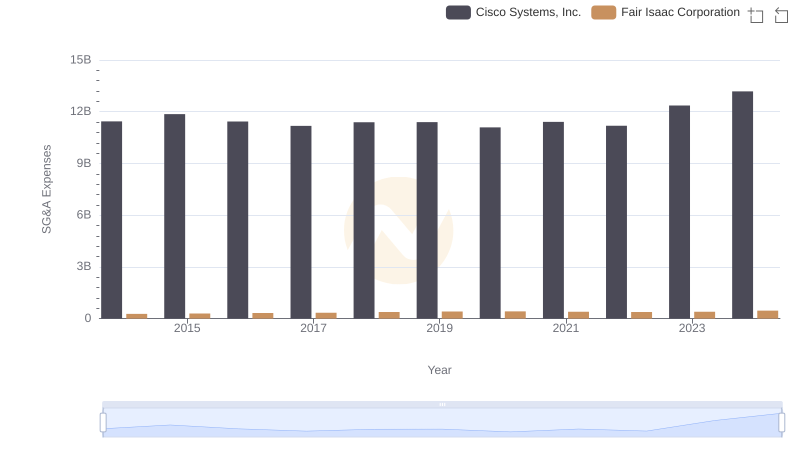
SG&A Efficiency Analysis: Comparing Cisco Systems, Inc. and Fair Isaac Corporation
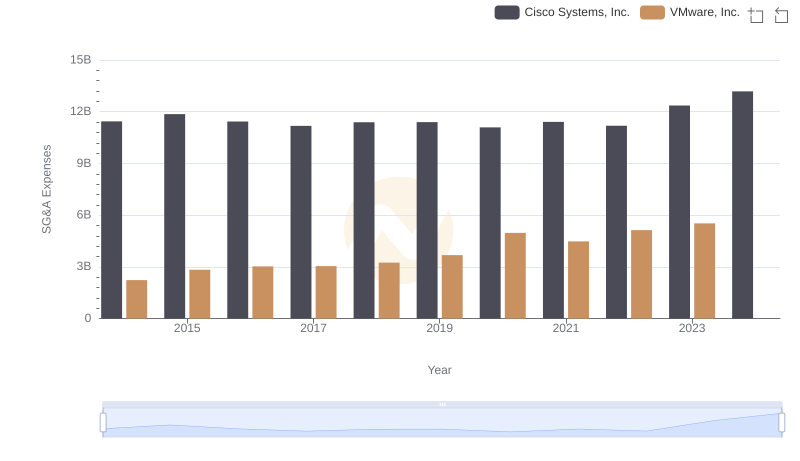
Cost Management Insights: SG&A Expenses for Cisco Systems, Inc. and VMware, Inc.
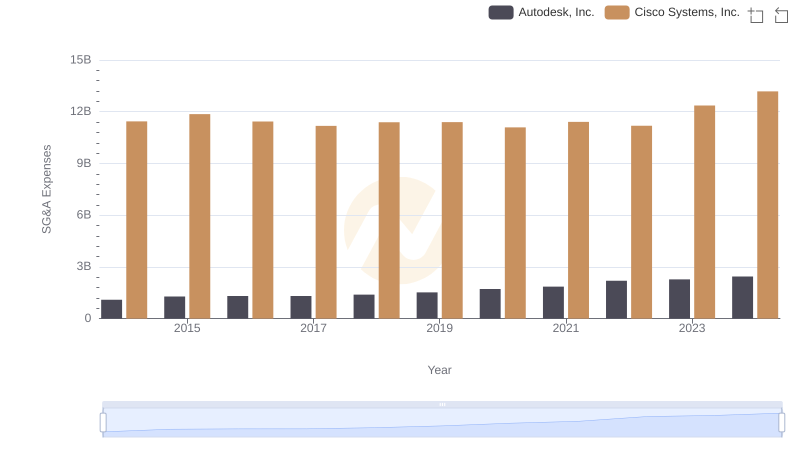
Breaking Down SG&A Expenses: Cisco Systems, Inc. vs Autodesk, Inc.
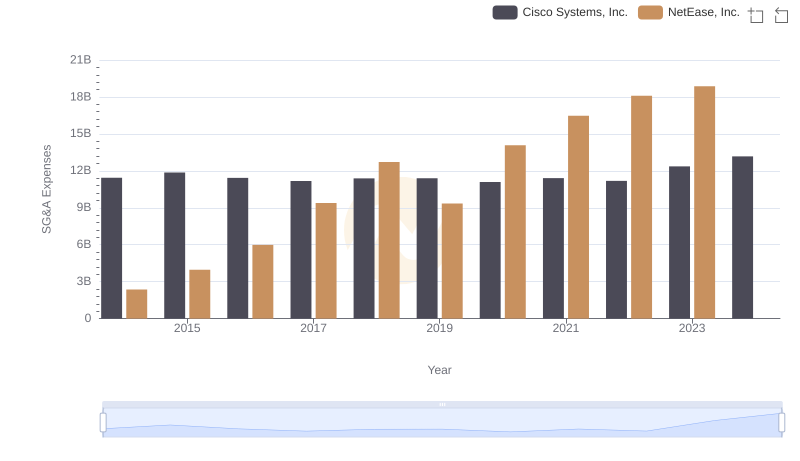
Selling, General, and Administrative Costs: Cisco Systems, Inc. vs NetEase, Inc.
Cisco Systems, Inc. or NXP Semiconductors N.V.: Who Manages SG&A Costs Better?
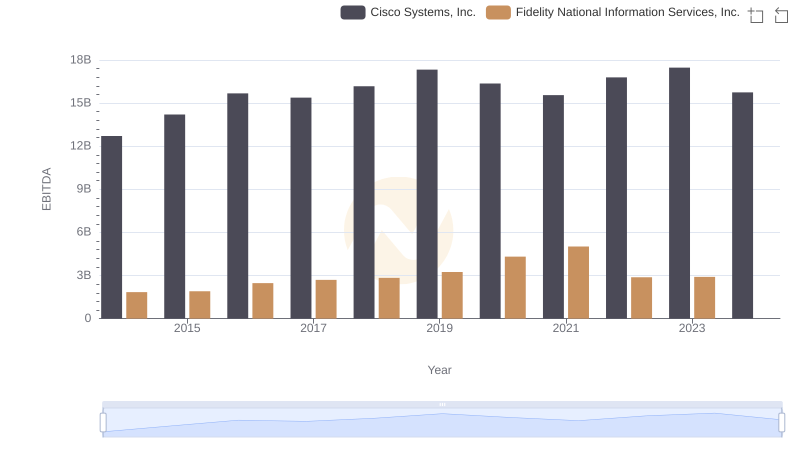
Comprehensive EBITDA Comparison: Cisco Systems, Inc. vs Fidelity National Information Services, Inc.