| __timestamp | Cisco Systems, Inc. | Cognizant Technology Solutions Corporation |
|---|---|---|
| Wednesday, January 1, 2014 | 47142000000 | 10262681000 |
| Thursday, January 1, 2015 | 49161000000 | 12416000000 |
| Friday, January 1, 2016 | 49247000000 | 13487000000 |
| Sunday, January 1, 2017 | 48005000000 | 14810000000 |
| Monday, January 1, 2018 | 49330000000 | 16125000000 |
| Tuesday, January 1, 2019 | 51904000000 | 16783000000 |
| Wednesday, January 1, 2020 | 49301000000 | 16652000000 |
| Friday, January 1, 2021 | 49818000000 | 18507000000 |
| Saturday, January 1, 2022 | 51557000000 | 19428000000 |
| Sunday, January 1, 2023 | 56998000000 | 19353000000 |
| Monday, January 1, 2024 | 53803000000 | 19736000000 |
Cracking the code
In the ever-evolving tech industry, revenue growth is a key indicator of a company's success. Over the past decade, Cisco Systems, Inc. and Cognizant Technology Solutions Corporation have demonstrated contrasting trajectories in their annual revenue growth.
Cisco has shown a consistent upward trend, with a notable 21% increase in revenue from 2014 to 2023. Despite a slight dip in 2020, Cisco rebounded strongly, reaching its peak in 2023. This resilience highlights Cisco's ability to adapt and thrive in a competitive market.
Cognizant, on the other hand, experienced a remarkable 89% growth from 2014 to 2022. However, the data for 2023 is missing, leaving a gap in the analysis. Cognizant's growth reflects its strategic expansion and innovation in digital solutions.
Both companies exemplify the dynamic nature of the tech industry, each carving its path to success.
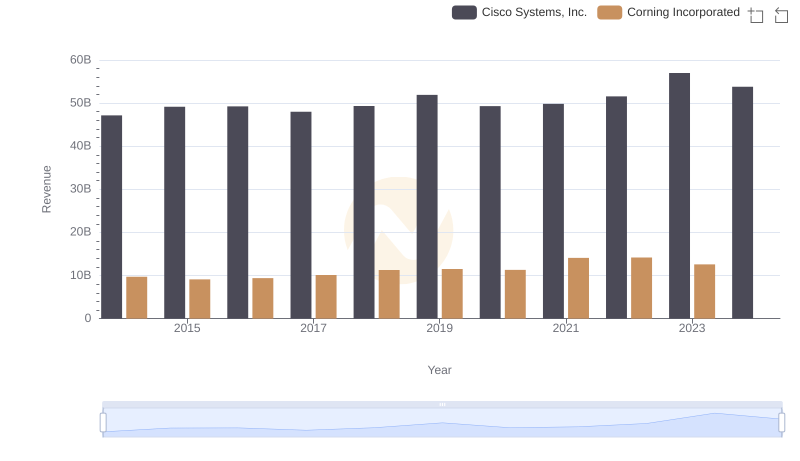
Annual Revenue Comparison: Cisco Systems, Inc. vs Corning Incorporated
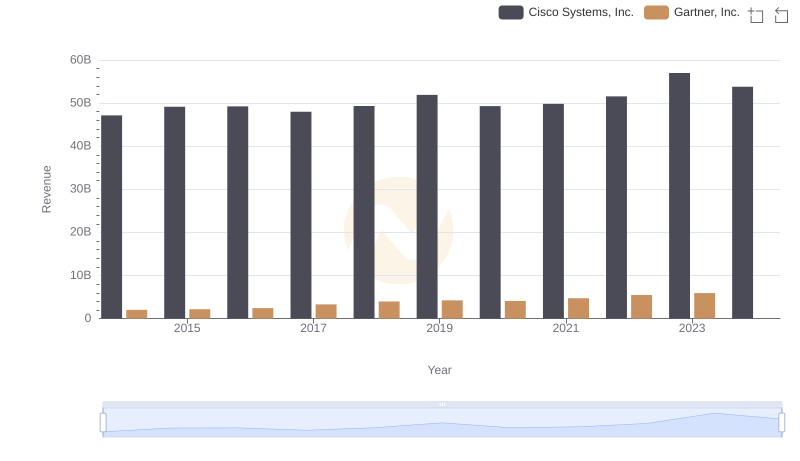
Comparing Revenue Performance: Cisco Systems, Inc. or Gartner, Inc.?
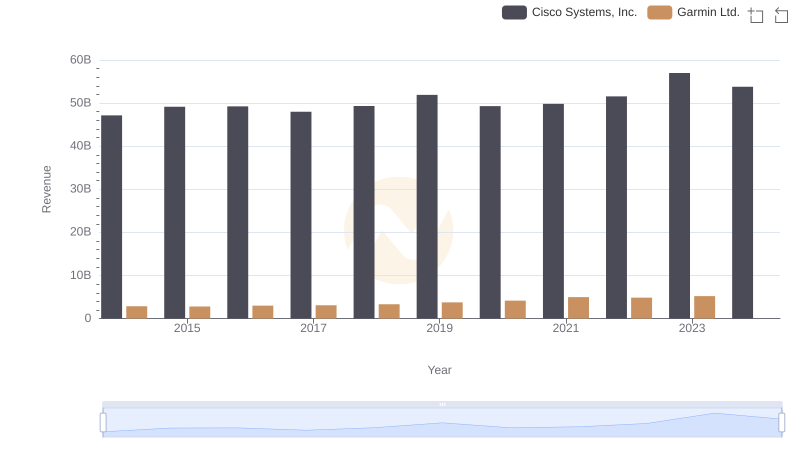
Comparing Revenue Performance: Cisco Systems, Inc. or Garmin Ltd.?
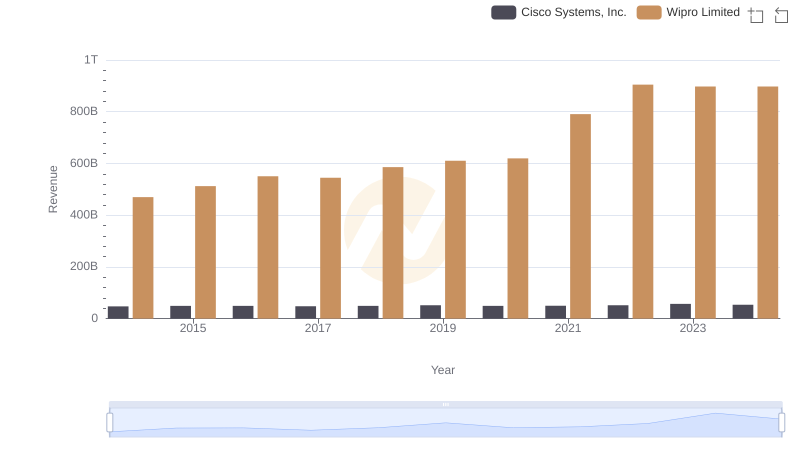
Revenue Insights: Cisco Systems, Inc. and Wipro Limited Performance Compared
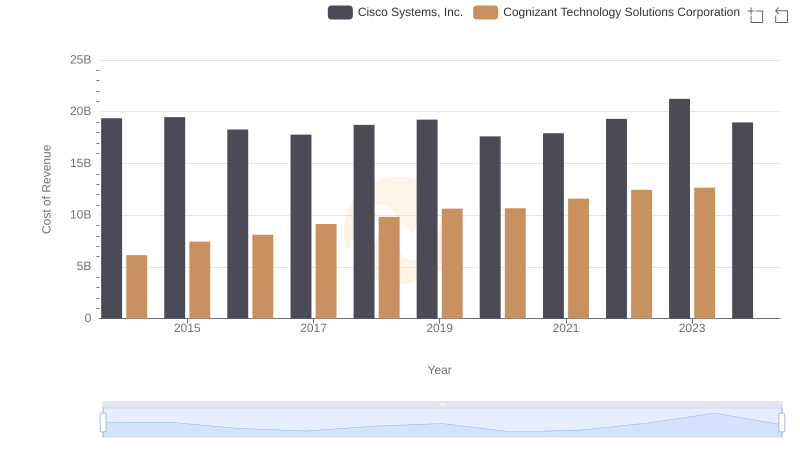
Analyzing Cost of Revenue: Cisco Systems, Inc. and Cognizant Technology Solutions Corporation
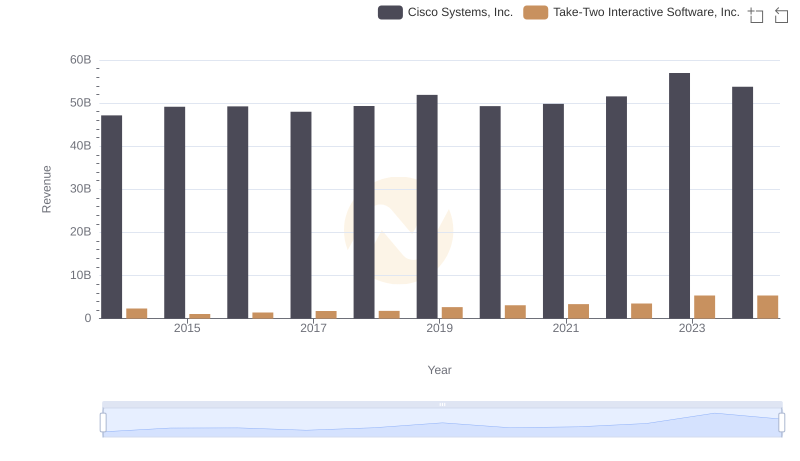
Annual Revenue Comparison: Cisco Systems, Inc. vs Take-Two Interactive Software, Inc.

Cisco Systems, Inc. or HubSpot, Inc.: Who Leads in Yearly Revenue?
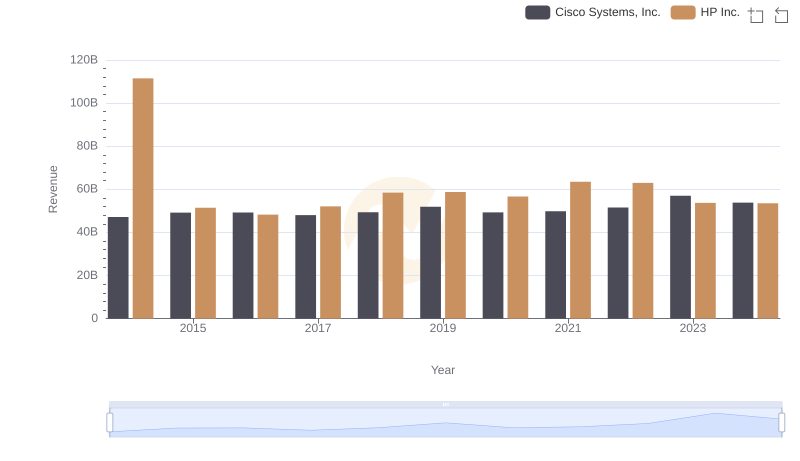
Cisco Systems, Inc. and HP Inc.: A Comprehensive Revenue Analysis

Cisco Systems, Inc. and Cognizant Technology Solutions Corporation: A Detailed Gross Profit Analysis
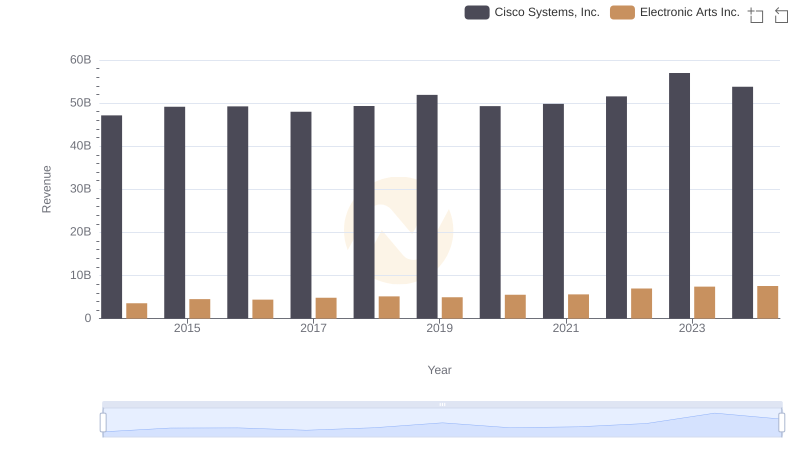
Cisco Systems, Inc. or Electronic Arts Inc.: Who Leads in Yearly Revenue?
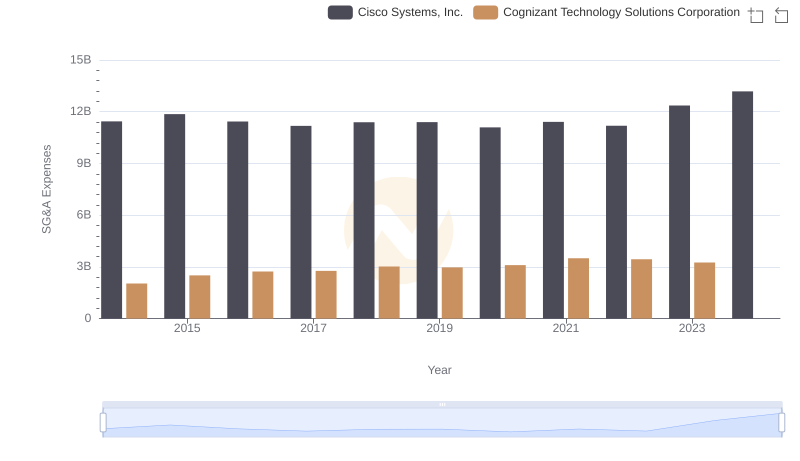
Cisco Systems, Inc. and Cognizant Technology Solutions Corporation: SG&A Spending Patterns Compared

Cisco Systems, Inc. vs Cognizant Technology Solutions Corporation: In-Depth EBITDA Performance Comparison