| __timestamp | 3M Company | Cintas Corporation |
|---|---|---|
| Wednesday, January 1, 2014 | 6469000000 | 1302752000 |
| Thursday, January 1, 2015 | 6182000000 | 1224930000 |
| Friday, January 1, 2016 | 6111000000 | 1348122000 |
| Sunday, January 1, 2017 | 6572000000 | 1527380000 |
| Monday, January 1, 2018 | 7602000000 | 1916792000 |
| Tuesday, January 1, 2019 | 7029000000 | 1980644000 |
| Wednesday, January 1, 2020 | 6929000000 | 2071052000 |
| Friday, January 1, 2021 | 7197000000 | 1929159000 |
| Saturday, January 1, 2022 | 9049000000 | 2044876000 |
| Sunday, January 1, 2023 | 21526000000 | 2370704000 |
| Monday, January 1, 2024 | 4221000000 | 2617783000 |
Igniting the spark of knowledge
In the world of corporate finance, understanding a company's spending patterns can reveal much about its strategic priorities. Over the past decade, Cintas Corporation and 3M Company have showcased distinct trends in their Selling, General, and Administrative (SG&A) expenses. From 2014 to 2023, 3M's SG&A expenses have seen a dramatic increase, peaking in 2023 with a staggering 166% rise compared to 2014. This surge reflects 3M's aggressive expansion and investment in operational efficiencies. In contrast, Cintas has demonstrated a more steady growth trajectory, with a 102% increase over the same period, indicating a balanced approach to scaling operations. The year 2023 marked a pivotal point, with 3M's expenses reaching over eight times that of Cintas, highlighting the contrasting scales and strategies of these industry leaders. As we look to the future, these patterns offer valuable insights into the evolving landscape of corporate expenditure.
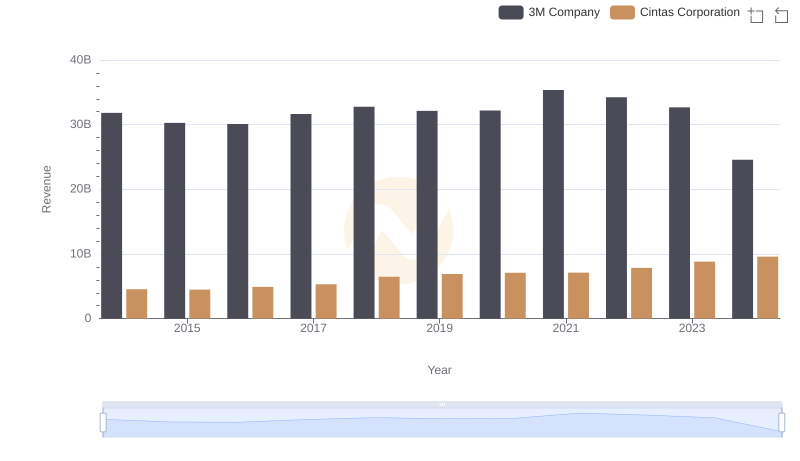
Cintas Corporation and 3M Company: A Comprehensive Revenue Analysis
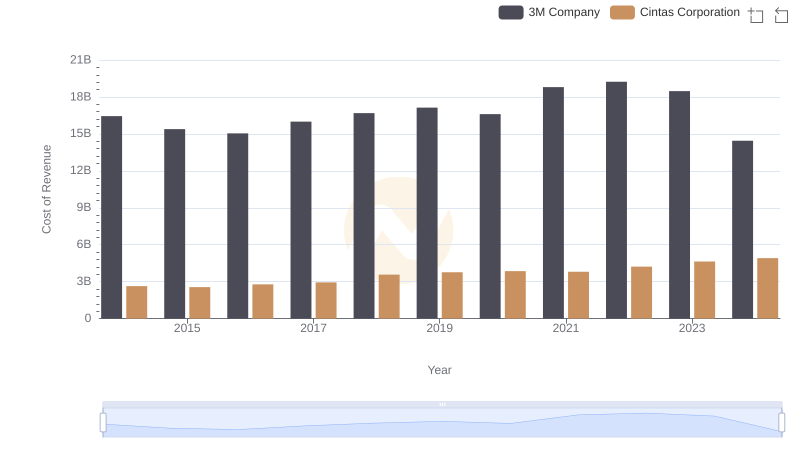
Analyzing Cost of Revenue: Cintas Corporation and 3M Company
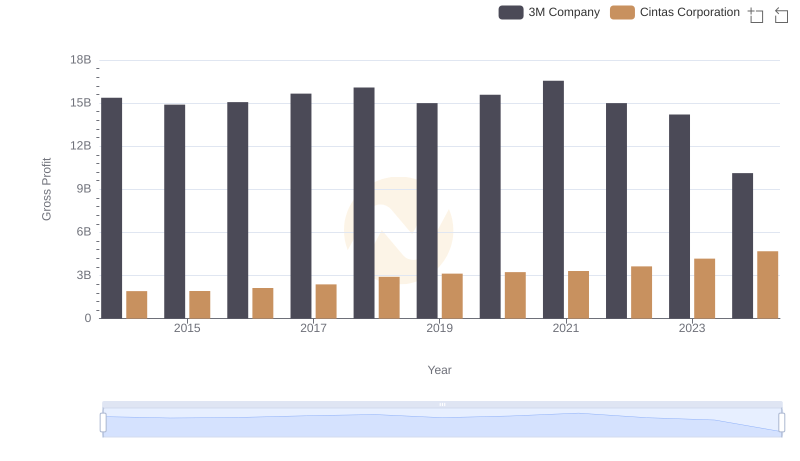
Who Generates Higher Gross Profit? Cintas Corporation or 3M Company
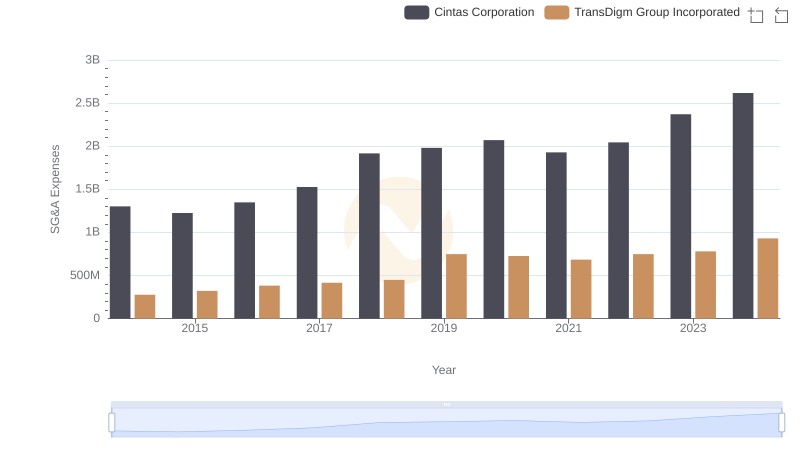
Cintas Corporation or TransDigm Group Incorporated: Who Manages SG&A Costs Better?
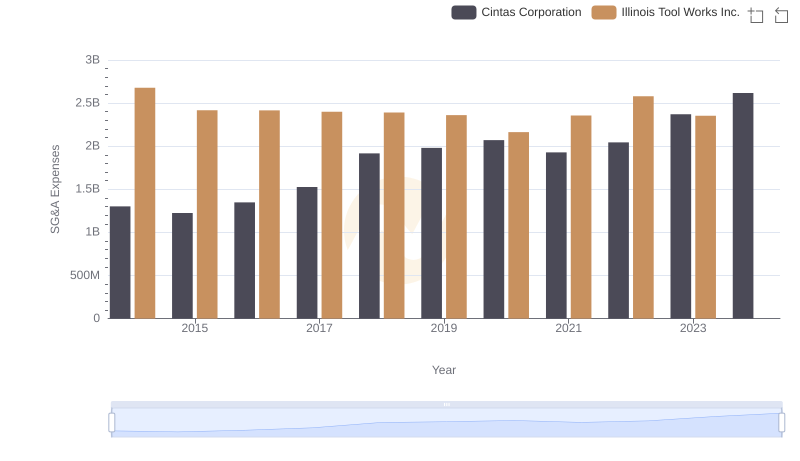
Breaking Down SG&A Expenses: Cintas Corporation vs Illinois Tool Works Inc.
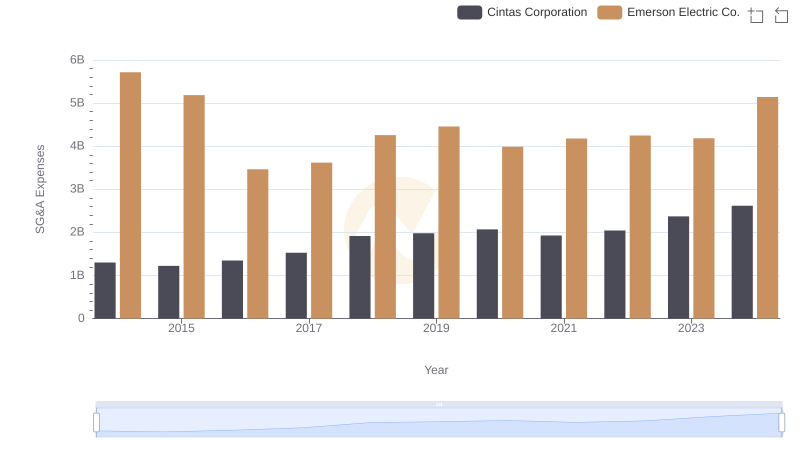
Cintas Corporation vs Emerson Electric Co.: SG&A Expense Trends

Cost Management Insights: SG&A Expenses for Cintas Corporation and Republic Services, Inc.
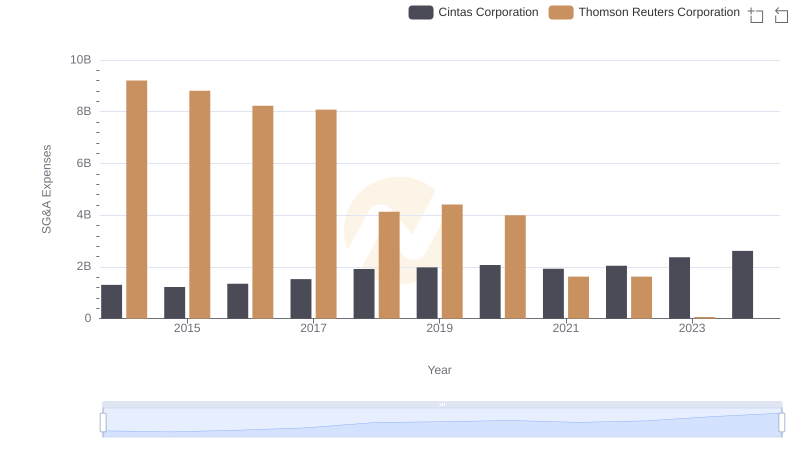
Cost Management Insights: SG&A Expenses for Cintas Corporation and Thomson Reuters Corporation
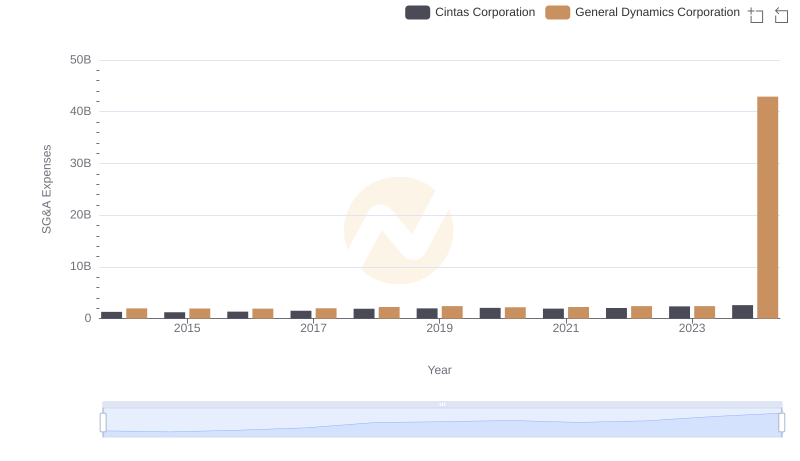
Comparing SG&A Expenses: Cintas Corporation vs General Dynamics Corporation Trends and Insights
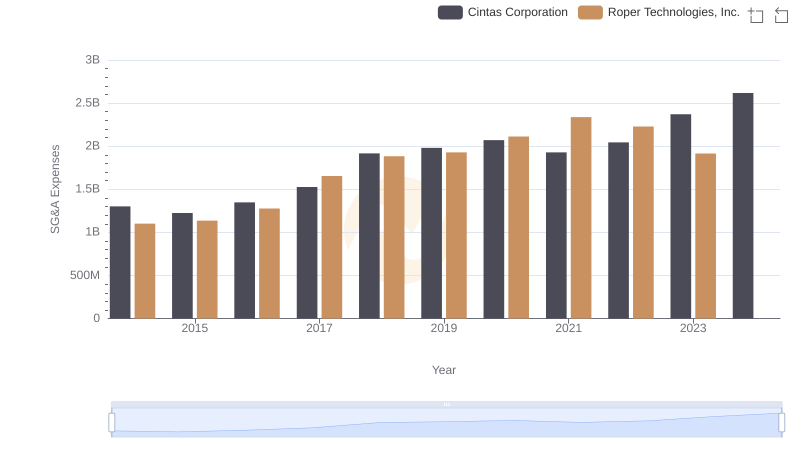
Comparing SG&A Expenses: Cintas Corporation vs Roper Technologies, Inc. Trends and Insights
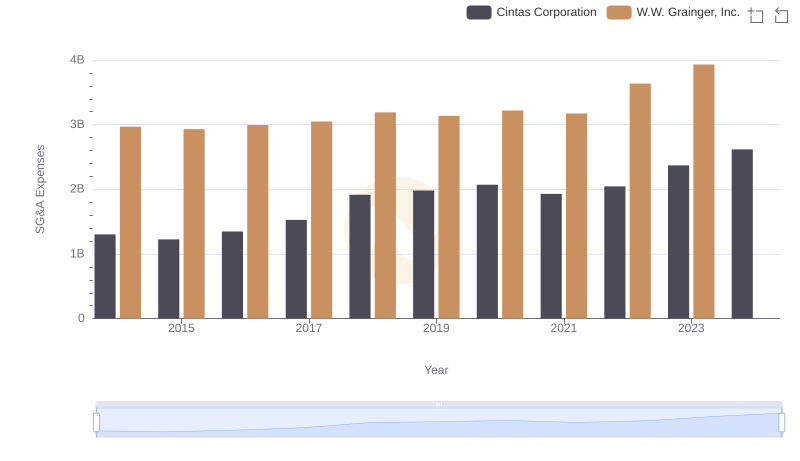
Cintas Corporation vs W.W. Grainger, Inc.: SG&A Expense Trends