| __timestamp | 3M Company | Cintas Corporation |
|---|---|---|
| Wednesday, January 1, 2014 | 31821000000 | 4551812000 |
| Thursday, January 1, 2015 | 30274000000 | 4476886000 |
| Friday, January 1, 2016 | 30109000000 | 4905458000 |
| Sunday, January 1, 2017 | 31657000000 | 5323381000 |
| Monday, January 1, 2018 | 32765000000 | 6476632000 |
| Tuesday, January 1, 2019 | 32136000000 | 6892303000 |
| Wednesday, January 1, 2020 | 32184000000 | 7085120000 |
| Friday, January 1, 2021 | 35355000000 | 7116340000 |
| Saturday, January 1, 2022 | 34229000000 | 7854459000 |
| Sunday, January 1, 2023 | 32681000000 | 8815769000 |
| Monday, January 1, 2024 | 24575000000 | 9596615000 |
Unveiling the hidden dimensions of data
In the ever-evolving landscape of corporate America, Cintas Corporation and 3M Company stand as titans in their respective fields. Over the past decade, these companies have showcased remarkable resilience and growth. From 2014 to 2023, Cintas Corporation's revenue surged by approximately 116%, reflecting its robust expansion strategy and market adaptability. In contrast, 3M Company, a stalwart in the industrial sector, experienced a more modest revenue growth of around 3% during the same period.
The year 2021 marked a significant peak for 3M, with revenues reaching their zenith, only to see a decline by 2024. Meanwhile, Cintas continued its upward trajectory, culminating in a record revenue in 2024. This analysis underscores the dynamic nature of business growth and the varying strategies employed by industry leaders to navigate economic challenges and opportunities.
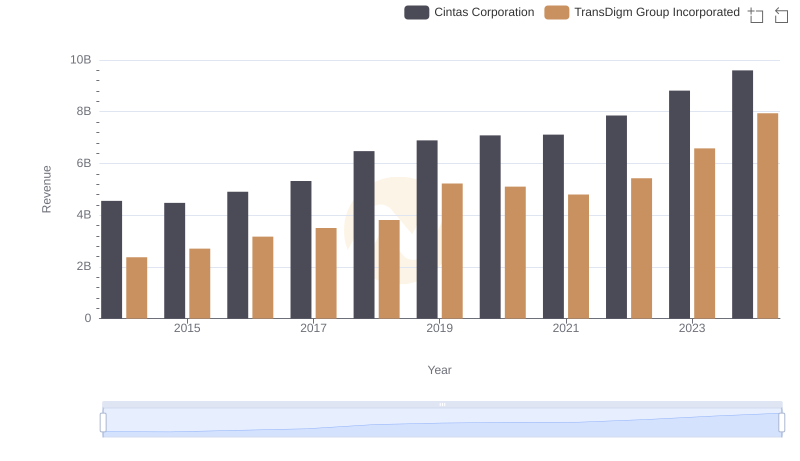
Cintas Corporation or TransDigm Group Incorporated: Who Leads in Yearly Revenue?
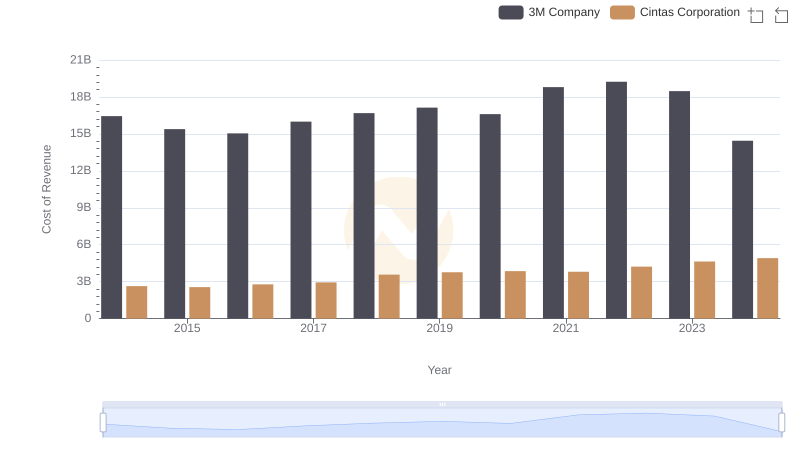
Analyzing Cost of Revenue: Cintas Corporation and 3M Company
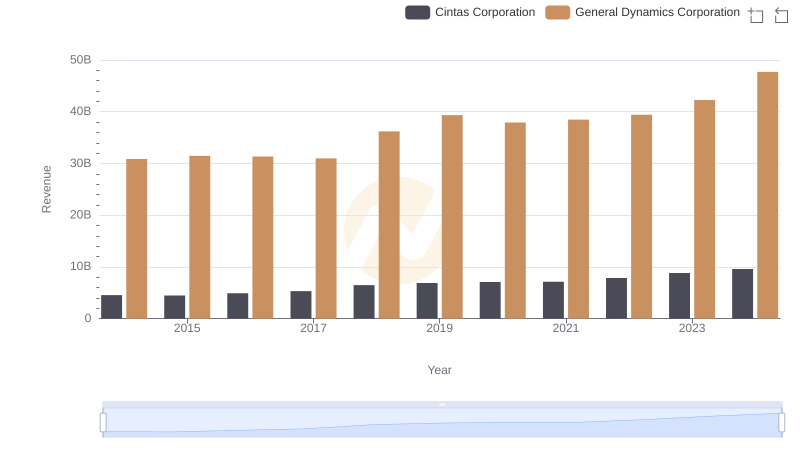
Comparing Revenue Performance: Cintas Corporation or General Dynamics Corporation?
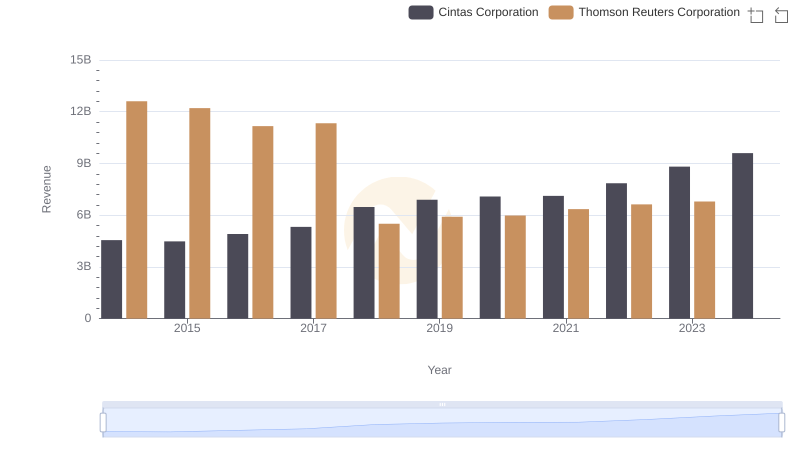
Breaking Down Revenue Trends: Cintas Corporation vs Thomson Reuters Corporation
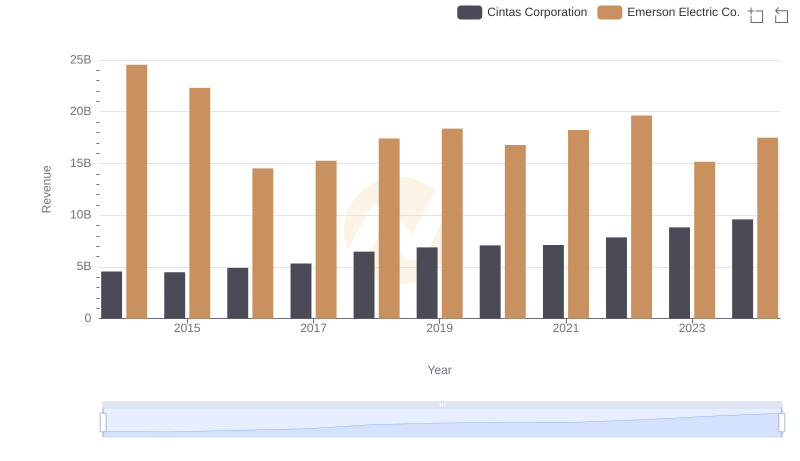
Revenue Showdown: Cintas Corporation vs Emerson Electric Co.
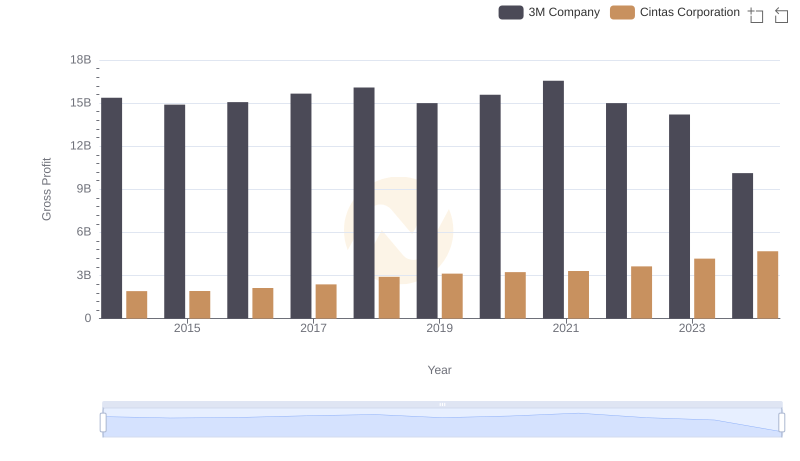
Who Generates Higher Gross Profit? Cintas Corporation or 3M Company
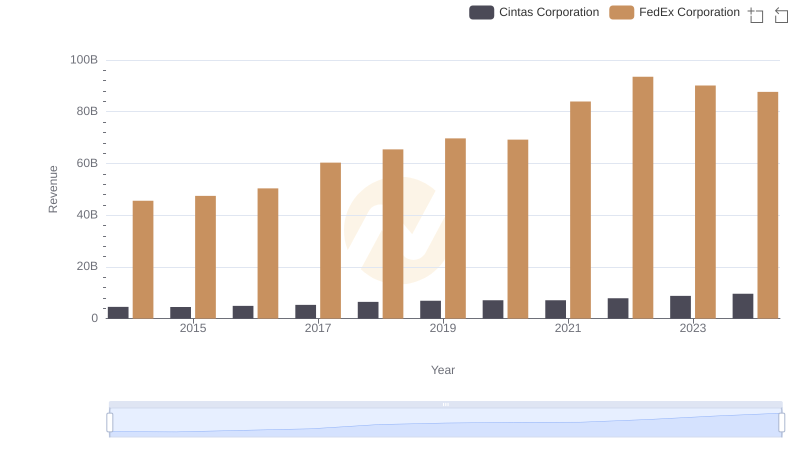
Cintas Corporation vs FedEx Corporation: Annual Revenue Growth Compared
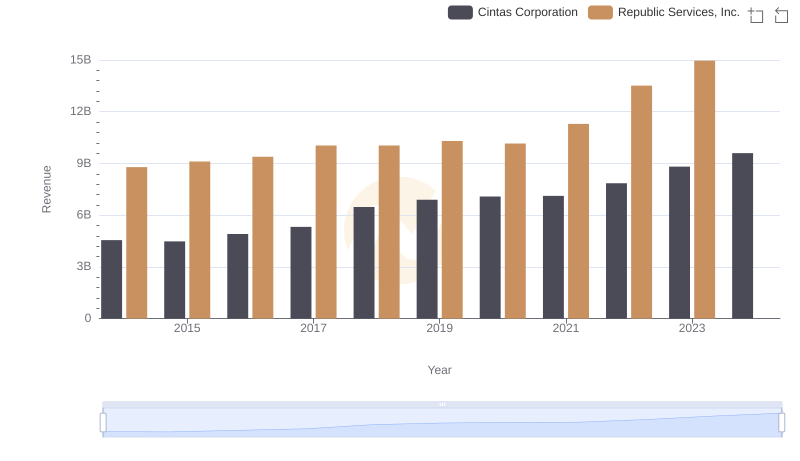
Cintas Corporation or Republic Services, Inc.: Who Leads in Yearly Revenue?
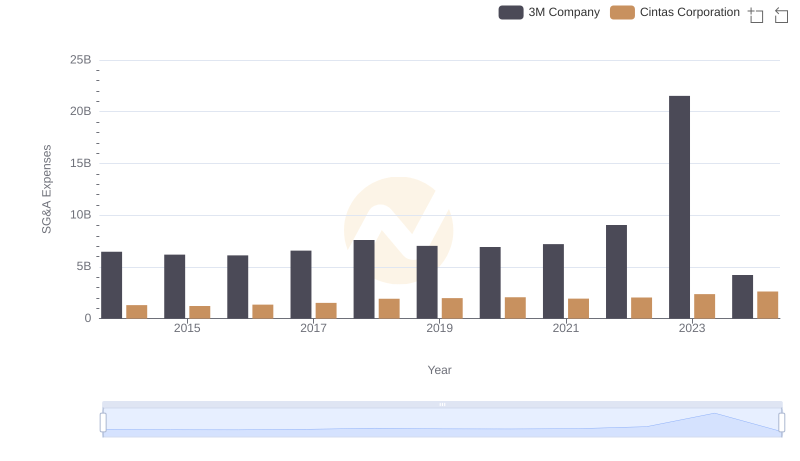
Cintas Corporation and 3M Company: SG&A Spending Patterns Compared