| __timestamp | 3M Company | Cintas Corporation |
|---|---|---|
| Wednesday, January 1, 2014 | 16447000000 | 2637426000 |
| Thursday, January 1, 2015 | 15383000000 | 2555549000 |
| Friday, January 1, 2016 | 15040000000 | 2775588000 |
| Sunday, January 1, 2017 | 16001000000 | 2943086000 |
| Monday, January 1, 2018 | 16682000000 | 3568109000 |
| Tuesday, January 1, 2019 | 17136000000 | 3763715000 |
| Wednesday, January 1, 2020 | 16605000000 | 3851372000 |
| Friday, January 1, 2021 | 18795000000 | 3801689000 |
| Saturday, January 1, 2022 | 19232000000 | 4222213000 |
| Sunday, January 1, 2023 | 18477000000 | 4642401000 |
| Monday, January 1, 2024 | 14447000000 | 4910199000 |
Data in motion
In the ever-evolving landscape of corporate finance, understanding the cost of revenue is crucial for investors and analysts alike. This analysis delves into the financial performance of two industry giants, Cintas Corporation and 3M Company, from 2014 to 2024. Over this decade, 3M's cost of revenue fluctuated, peaking in 2022 with a 15% increase from 2014, before dropping by 25% in 2024. Meanwhile, Cintas Corporation exhibited a steady upward trend, with a remarkable 86% increase in cost of revenue over the same period. This growth reflects Cintas's expanding operations and market reach. The contrasting trends between these companies highlight differing strategic approaches and market conditions. As we move forward, these insights provide a window into the financial health and strategic direction of these corporations, offering valuable information for stakeholders and potential investors.
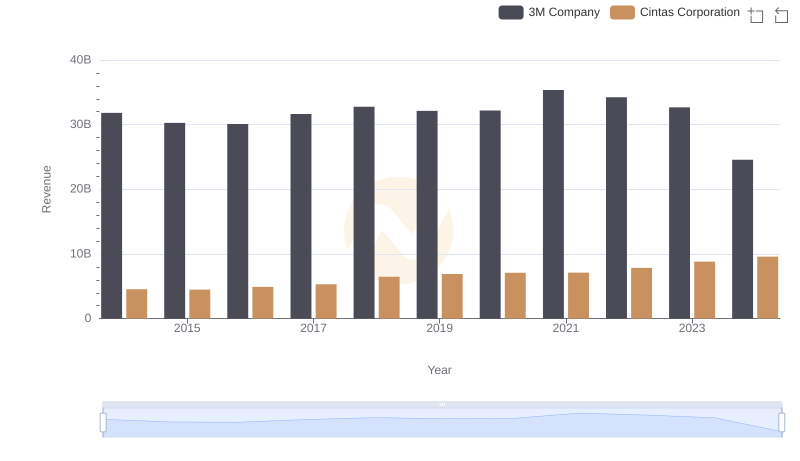
Cintas Corporation and 3M Company: A Comprehensive Revenue Analysis
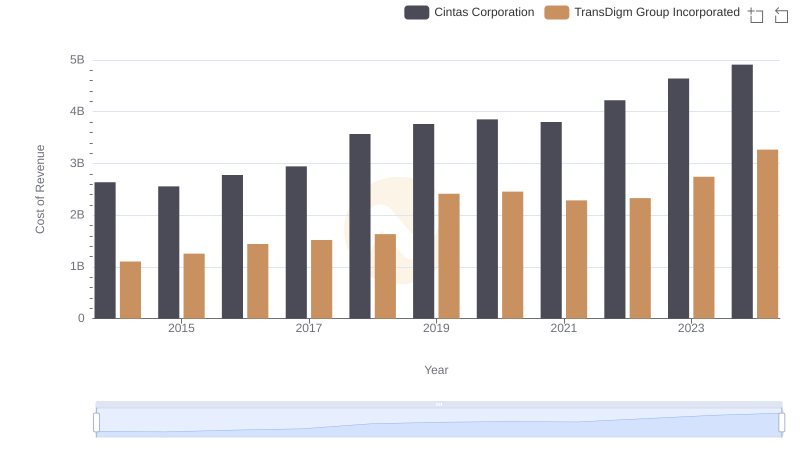
Cost of Revenue Comparison: Cintas Corporation vs TransDigm Group Incorporated
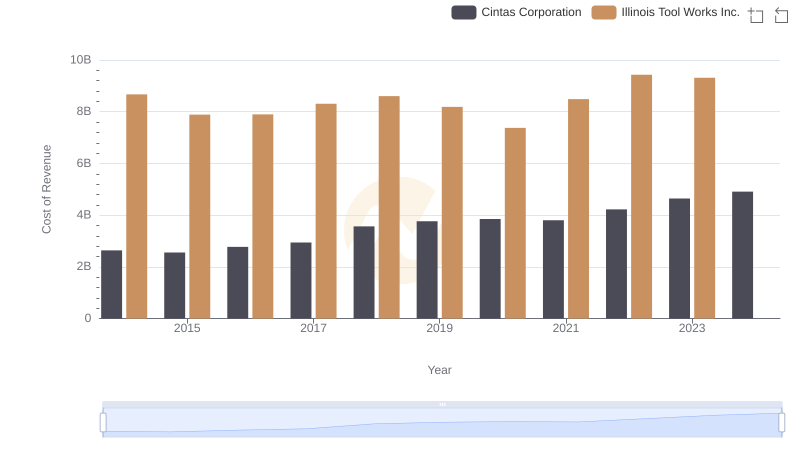
Cost of Revenue Comparison: Cintas Corporation vs Illinois Tool Works Inc.
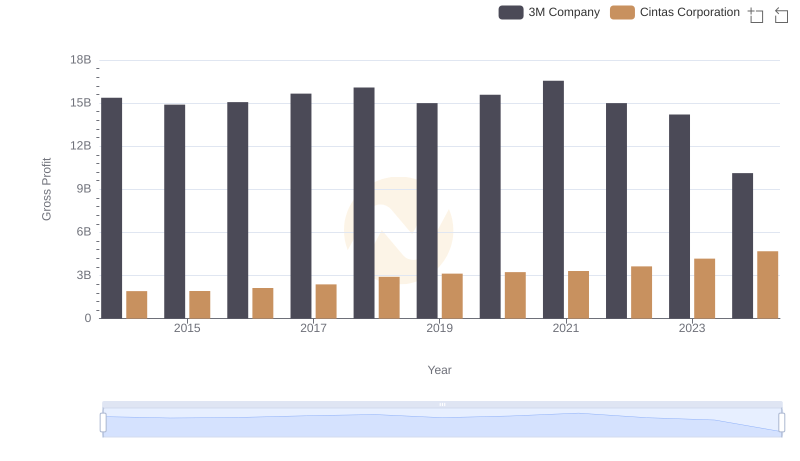
Who Generates Higher Gross Profit? Cintas Corporation or 3M Company
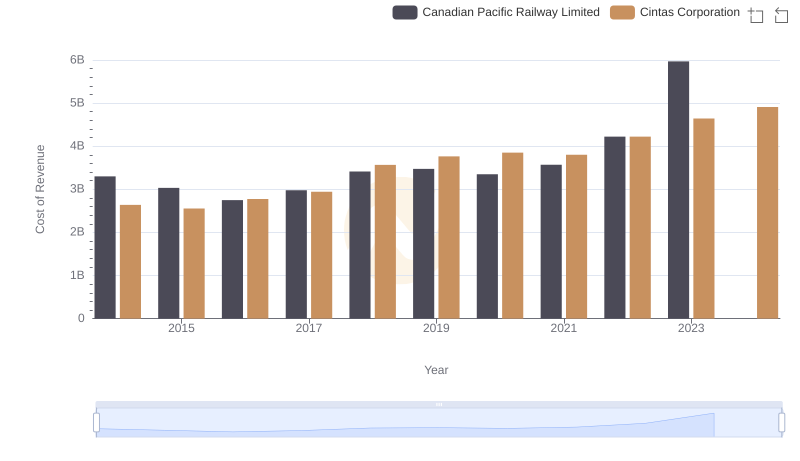
Cintas Corporation vs Canadian Pacific Railway Limited: Efficiency in Cost of Revenue Explored
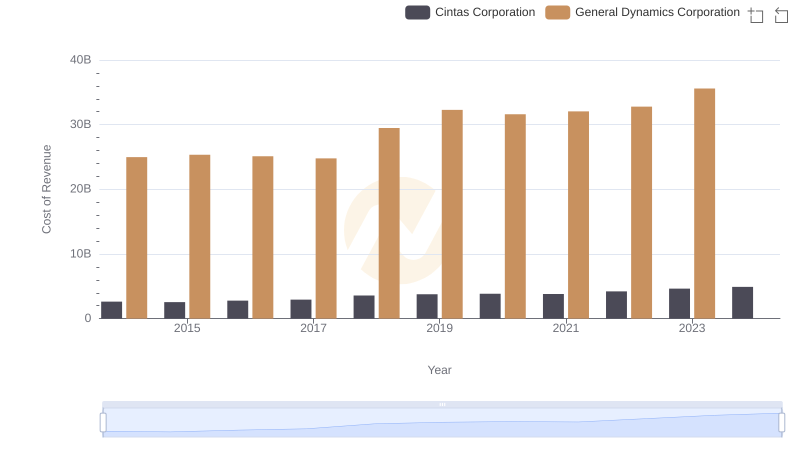
Cintas Corporation vs General Dynamics Corporation: Efficiency in Cost of Revenue Explored
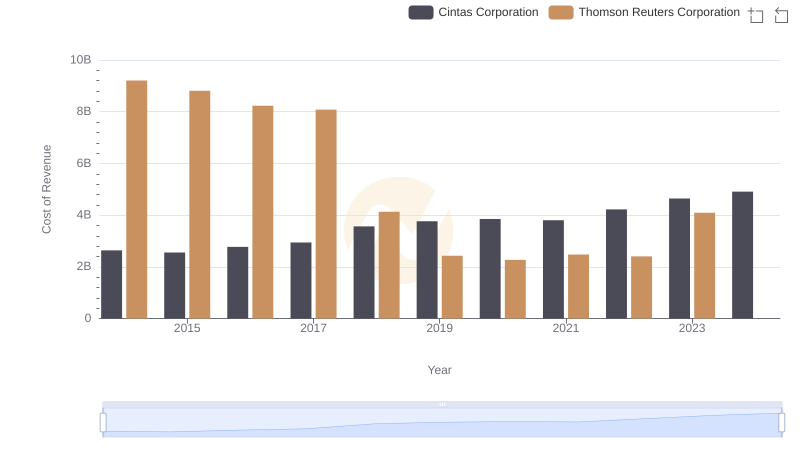
Cost Insights: Breaking Down Cintas Corporation and Thomson Reuters Corporation's Expenses
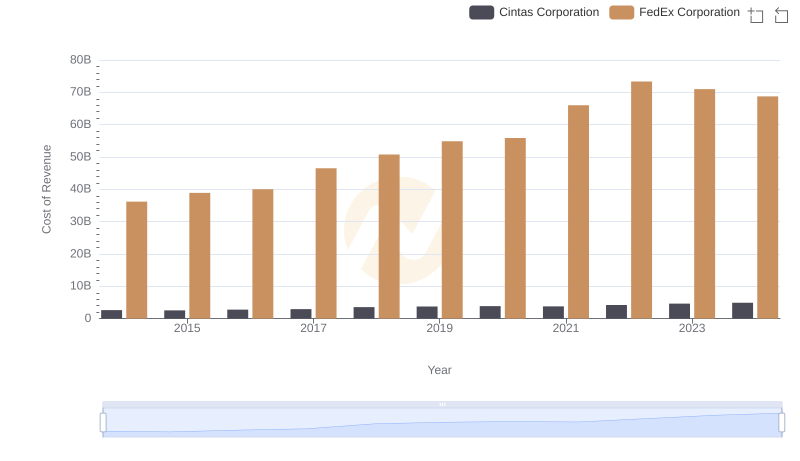
Cintas Corporation vs FedEx Corporation: Efficiency in Cost of Revenue Explored
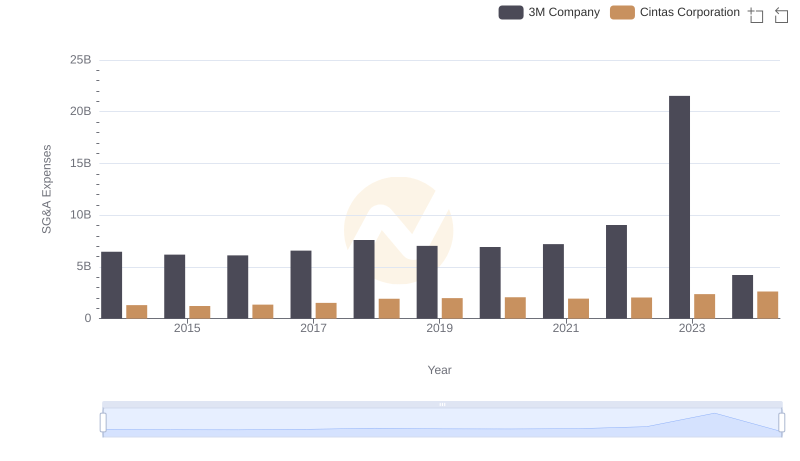
Cintas Corporation and 3M Company: SG&A Spending Patterns Compared
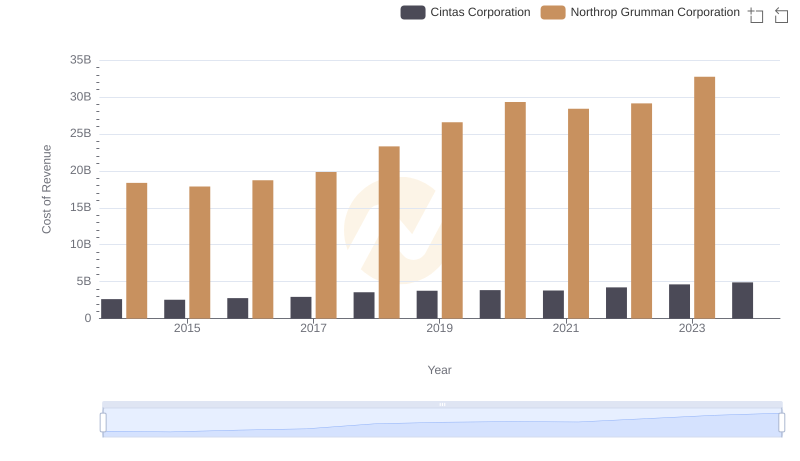
Cost of Revenue: Key Insights for Cintas Corporation and Northrop Grumman Corporation
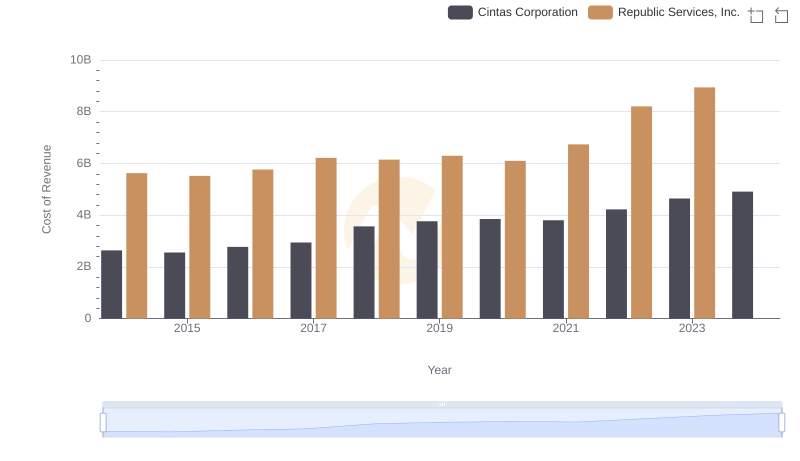
Cost Insights: Breaking Down Cintas Corporation and Republic Services, Inc.'s Expenses