| __timestamp | Waste Connections, Inc. | XPO Logistics, Inc. |
|---|---|---|
| Wednesday, January 1, 2014 | 1138388000 | 1975000000 |
| Thursday, January 1, 2015 | 1177409000 | 6538400000 |
| Friday, January 1, 2016 | 1957712000 | 12480100000 |
| Sunday, January 1, 2017 | 2704775000 | 13101100000 |
| Monday, January 1, 2018 | 2865704000 | 14738000000 |
| Tuesday, January 1, 2019 | 3198757000 | 13982000000 |
| Wednesday, January 1, 2020 | 3276808000 | 13689000000 |
| Friday, January 1, 2021 | 3654074000 | 10812000000 |
| Saturday, January 1, 2022 | 4336012000 | 6491000000 |
| Sunday, January 1, 2023 | 4744513000 | 6974000000 |
| Monday, January 1, 2024 | 5191706000 | 7157000000 |
Unlocking the unknown
In the competitive landscape of logistics and waste management, cost efficiency is paramount. Over the past decade, Waste Connections, Inc. and XPO Logistics, Inc. have demonstrated contrasting trajectories in their cost of revenue. From 2014 to 2023, Waste Connections saw a steady increase, with costs rising from approximately $1.1 billion to $4.7 billion, reflecting a growth of over 300%. This suggests a strategic expansion and investment in operations.
Conversely, XPO Logistics experienced a more volatile journey. Starting at nearly $2 billion in 2014, their costs peaked at $14.7 billion in 2018, before declining to around $7 billion by 2023. This 50% reduction in recent years indicates a significant restructuring or efficiency drive.
These trends highlight the dynamic nature of cost management strategies in the industry, offering valuable insights for investors and stakeholders.
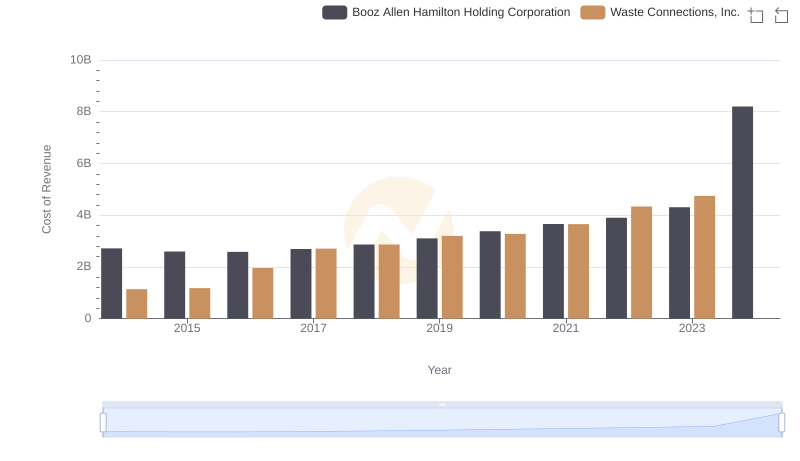
Cost Insights: Breaking Down Waste Connections, Inc. and Booz Allen Hamilton Holding Corporation's Expenses

Analyzing Cost of Revenue: Waste Connections, Inc. and Expeditors International of Washington, Inc.
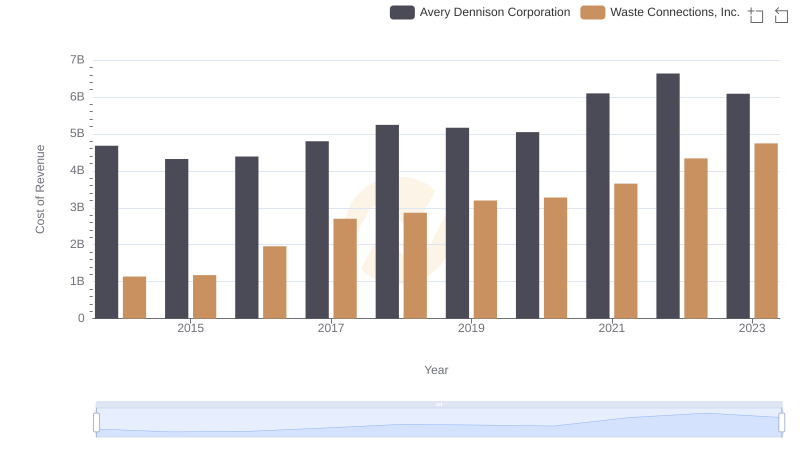
Cost Insights: Breaking Down Waste Connections, Inc. and Avery Dennison Corporation's Expenses
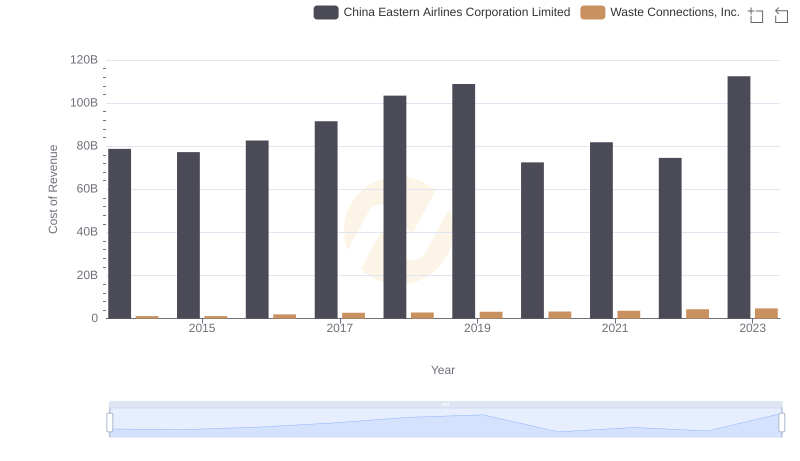
Comparing Cost of Revenue Efficiency: Waste Connections, Inc. vs China Eastern Airlines Corporation Limited
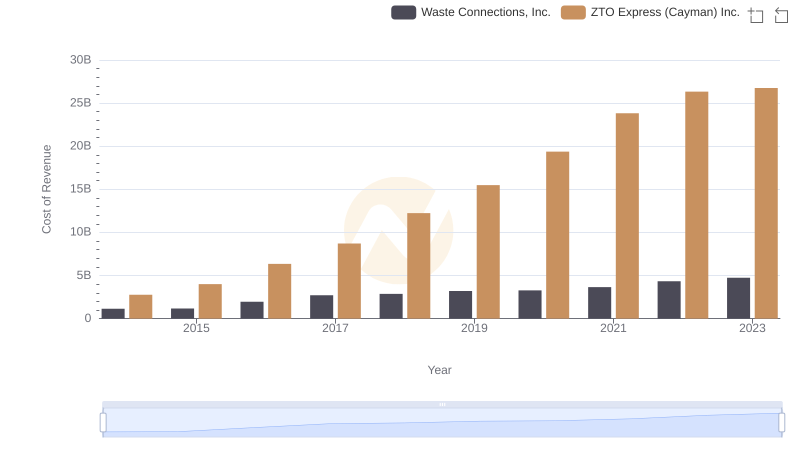
Cost Insights: Breaking Down Waste Connections, Inc. and ZTO Express (Cayman) Inc.'s Expenses
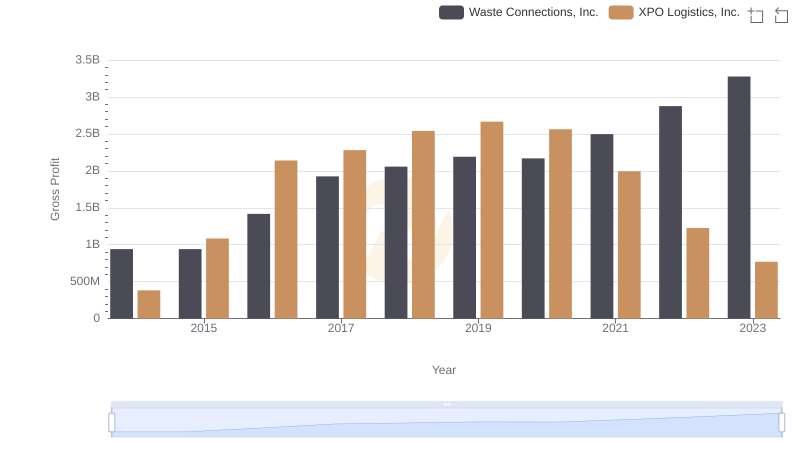
Who Generates Higher Gross Profit? Waste Connections, Inc. or XPO Logistics, Inc.
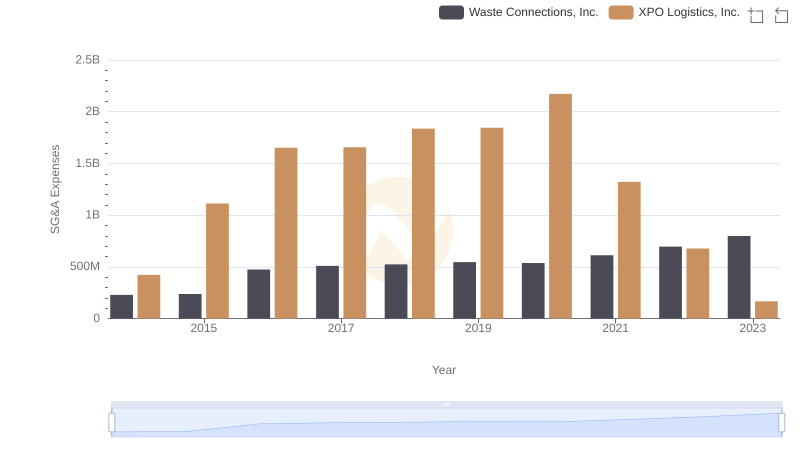
Breaking Down SG&A Expenses: Waste Connections, Inc. vs XPO Logistics, Inc.
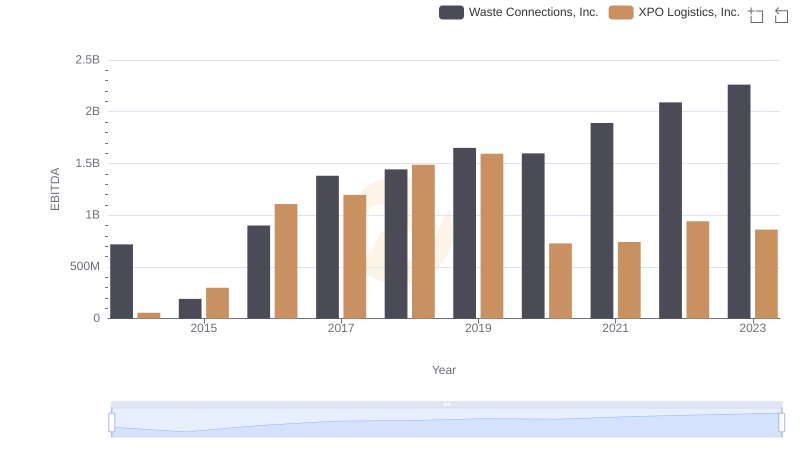
Comprehensive EBITDA Comparison: Waste Connections, Inc. vs XPO Logistics, Inc.