| __timestamp | RB Global, Inc. | Waste Connections, Inc. |
|---|---|---|
| Wednesday, January 1, 2014 | 248220000 | 229474000 |
| Thursday, January 1, 2015 | 254990000 | 237484000 |
| Friday, January 1, 2016 | 283529000 | 474263000 |
| Sunday, January 1, 2017 | 323270000 | 509638000 |
| Monday, January 1, 2018 | 382676000 | 524388000 |
| Tuesday, January 1, 2019 | 382389000 | 546278000 |
| Wednesday, January 1, 2020 | 417523000 | 537632000 |
| Friday, January 1, 2021 | 464599000 | 612337000 |
| Saturday, January 1, 2022 | 539933000 | 696467000 |
| Sunday, January 1, 2023 | 743700000 | 799119000 |
| Monday, January 1, 2024 | 773900000 | 883445000 |
Infusing magic into the data realm
In the competitive landscape of waste management and auction services, understanding the financial dynamics is crucial. Over the past decade, Waste Connections, Inc. and RB Global, Inc. have shown significant trends in their Selling, General, and Administrative (SG&A) expenses. From 2014 to 2023, Waste Connections, Inc. saw a remarkable increase of approximately 248% in SG&A expenses, peaking in 2023. Meanwhile, RB Global, Inc. experienced a 200% rise over the same period. Notably, both companies showed a consistent upward trajectory, with Waste Connections, Inc. maintaining a higher expense ratio, reflecting its expansive operational strategies. This trend highlights the growing administrative and operational costs in the industry, emphasizing the need for strategic financial management. As these companies continue to expand, monitoring SG&A expenses will be pivotal in maintaining profitability and competitive edge.
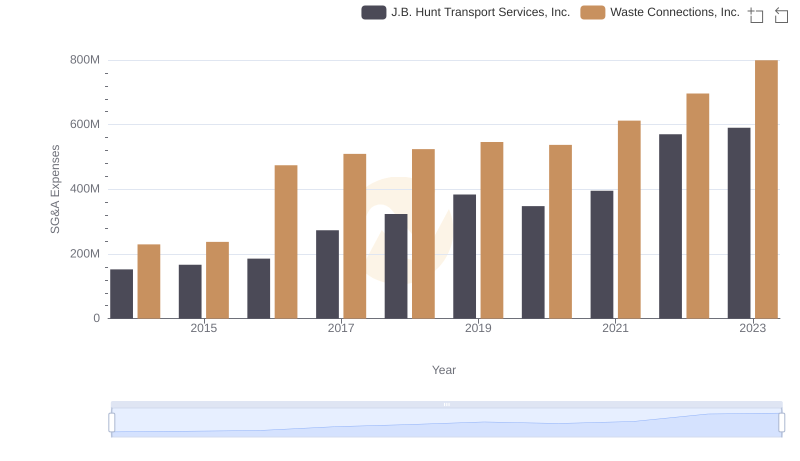
Cost Management Insights: SG&A Expenses for Waste Connections, Inc. and J.B. Hunt Transport Services, Inc.
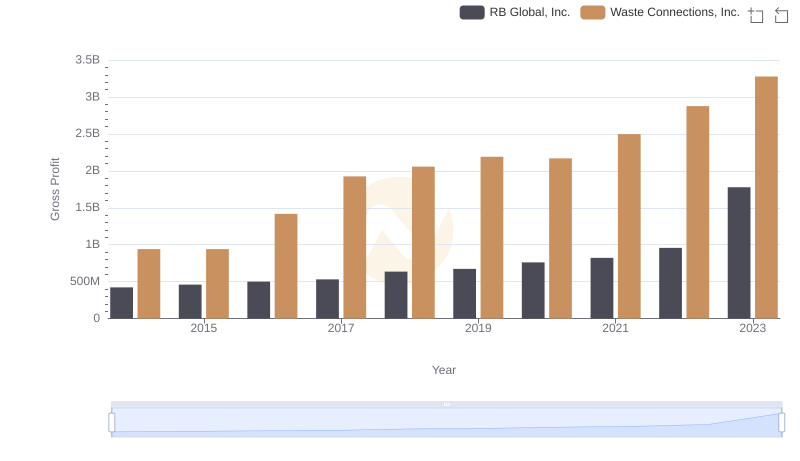
Waste Connections, Inc. and RB Global, Inc.: A Detailed Gross Profit Analysis
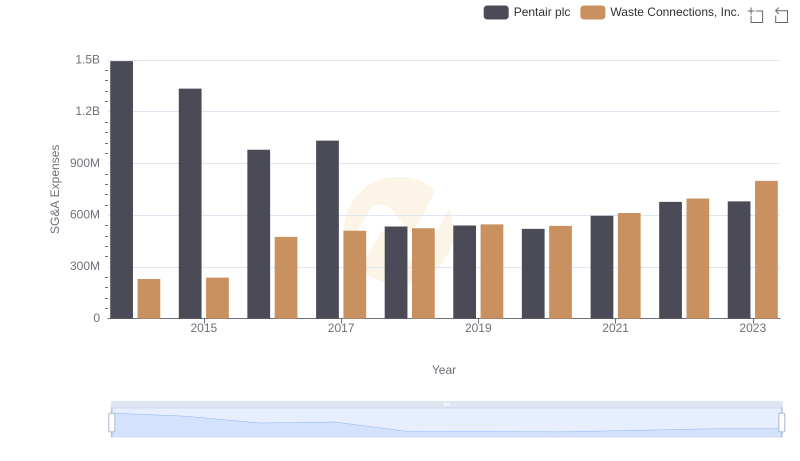
SG&A Efficiency Analysis: Comparing Waste Connections, Inc. and Pentair plc
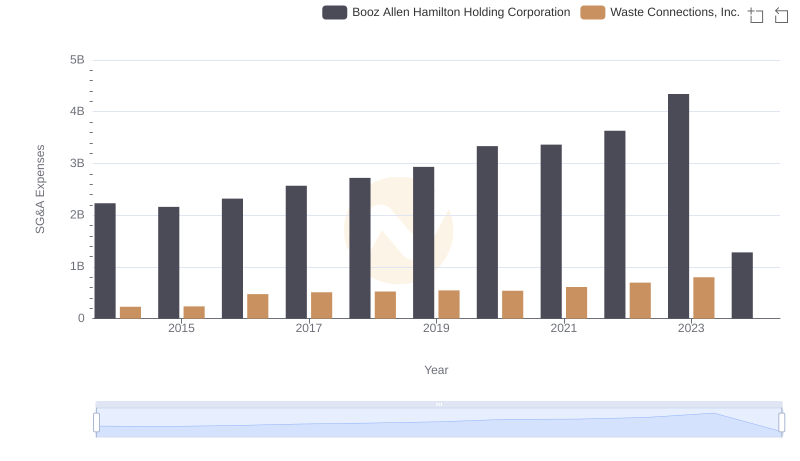
Who Optimizes SG&A Costs Better? Waste Connections, Inc. or Booz Allen Hamilton Holding Corporation
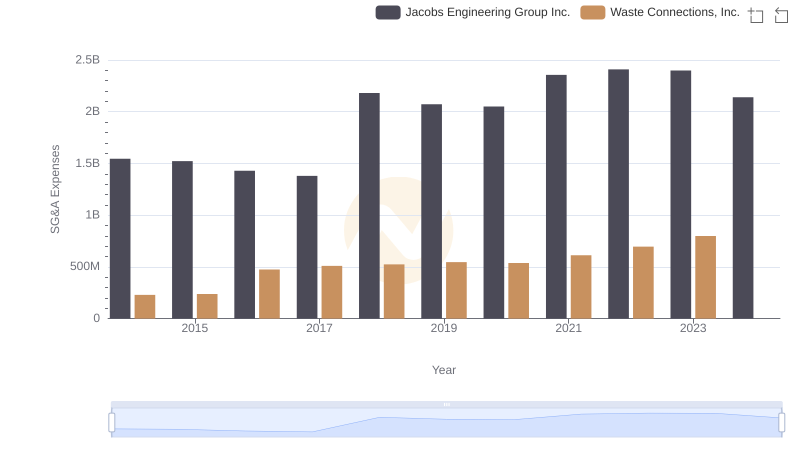
SG&A Efficiency Analysis: Comparing Waste Connections, Inc. and Jacobs Engineering Group Inc.
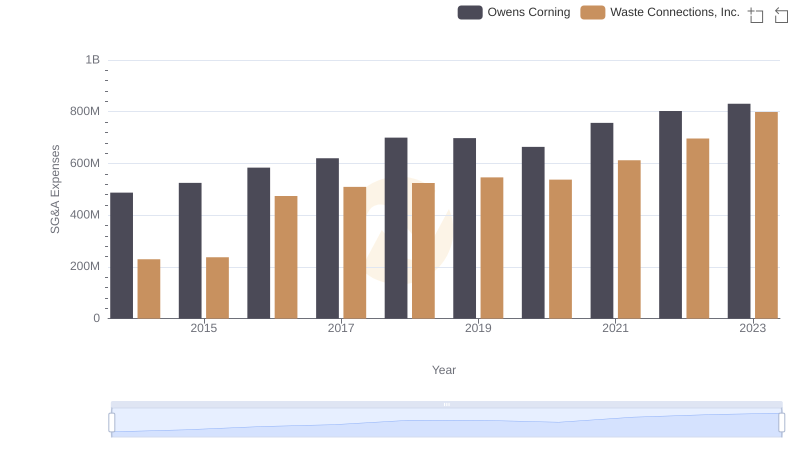
Who Optimizes SG&A Costs Better? Waste Connections, Inc. or Owens Corning

Waste Connections, Inc. and IDEX Corporation: SG&A Spending Patterns Compared
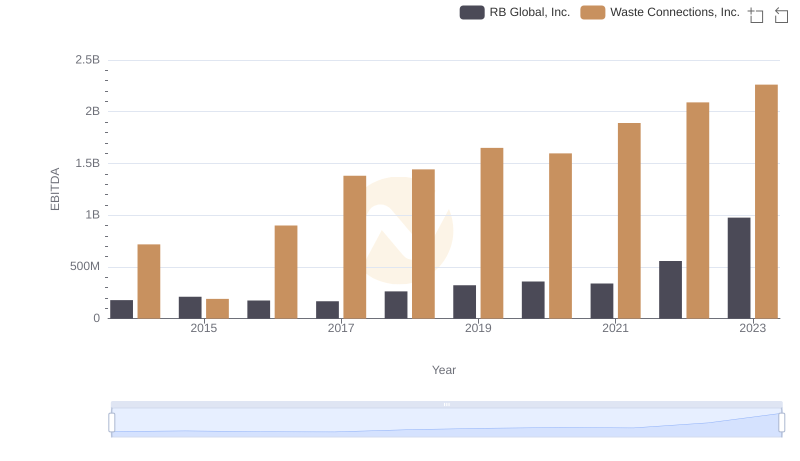
Professional EBITDA Benchmarking: Waste Connections, Inc. vs RB Global, Inc.
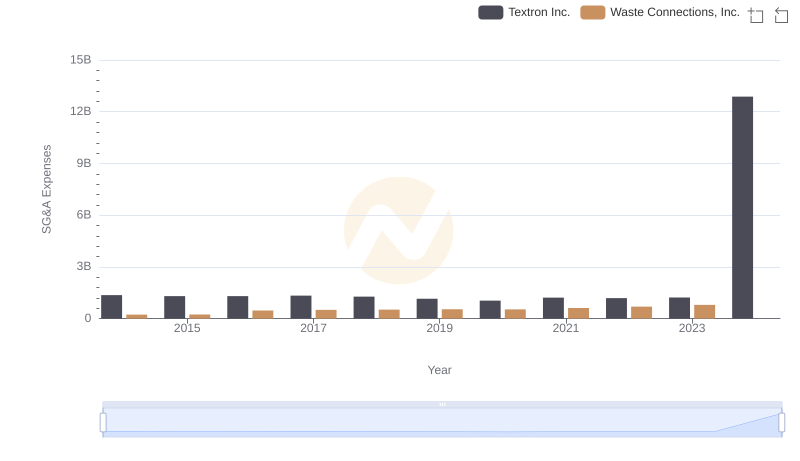
Breaking Down SG&A Expenses: Waste Connections, Inc. vs Textron Inc.