| __timestamp | Snap-on Incorporated | Waste Connections, Inc. |
|---|---|---|
| Wednesday, January 1, 2014 | 1047900000 | 229474000 |
| Thursday, January 1, 2015 | 1009100000 | 237484000 |
| Friday, January 1, 2016 | 1001400000 | 474263000 |
| Sunday, January 1, 2017 | 1101300000 | 509638000 |
| Monday, January 1, 2018 | 1080700000 | 524388000 |
| Tuesday, January 1, 2019 | 1071500000 | 546278000 |
| Wednesday, January 1, 2020 | 1054800000 | 537632000 |
| Friday, January 1, 2021 | 1202300000 | 612337000 |
| Saturday, January 1, 2022 | 1181200000 | 696467000 |
| Sunday, January 1, 2023 | 1249000000 | 799119000 |
| Monday, January 1, 2024 | 0 | 883445000 |
Unveiling the hidden dimensions of data
In the ever-evolving landscape of corporate finance, understanding operational costs is crucial. Over the past decade, Snap-on Incorporated and Waste Connections, Inc. have showcased distinct trends in their Selling, General, and Administrative (SG&A) expenses. From 2014 to 2023, Snap-on's SG&A expenses have seen a steady increase, peaking at a 19% rise by 2023. In contrast, Waste Connections, Inc. has experienced a more dramatic growth, with expenses surging by nearly 250% over the same period.
This divergence highlights the strategic differences between the two companies. Snap-on's consistent growth reflects a stable operational strategy, while Waste Connections' sharp increase suggests aggressive expansion or restructuring. As businesses navigate the complexities of the modern economy, these insights into SG&A trends offer valuable lessons in cost management and strategic planning.
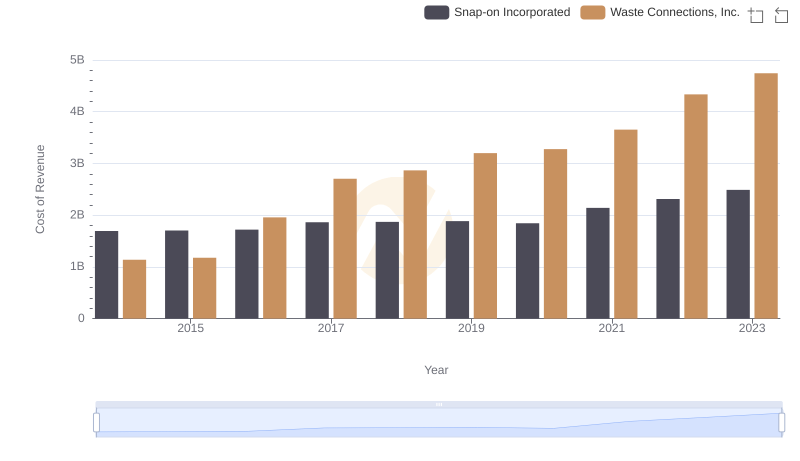
Waste Connections, Inc. vs Snap-on Incorporated: Efficiency in Cost of Revenue Explored
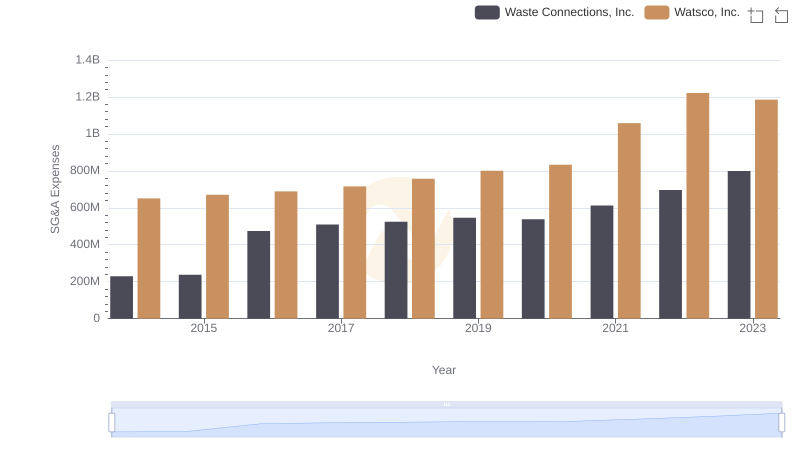
Comparing SG&A Expenses: Waste Connections, Inc. vs Watsco, Inc. Trends and Insights
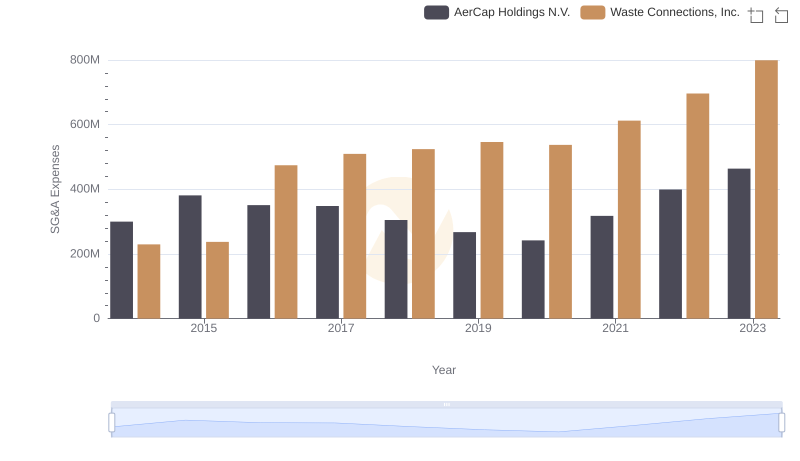
SG&A Efficiency Analysis: Comparing Waste Connections, Inc. and AerCap Holdings N.V.
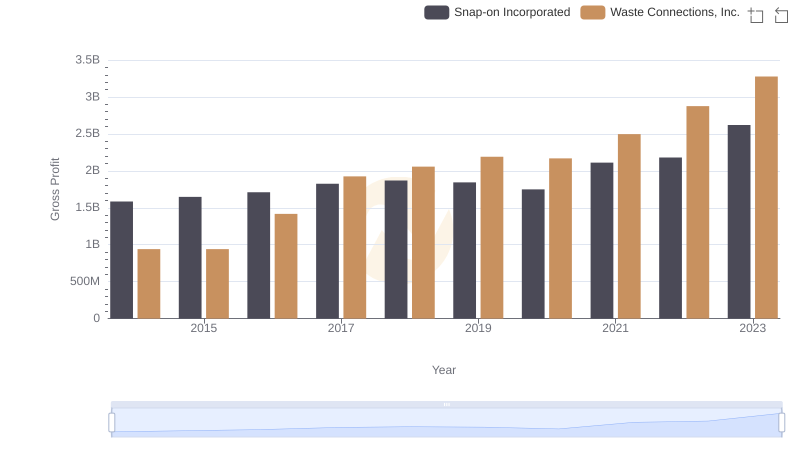
Waste Connections, Inc. vs Snap-on Incorporated: A Gross Profit Performance Breakdown
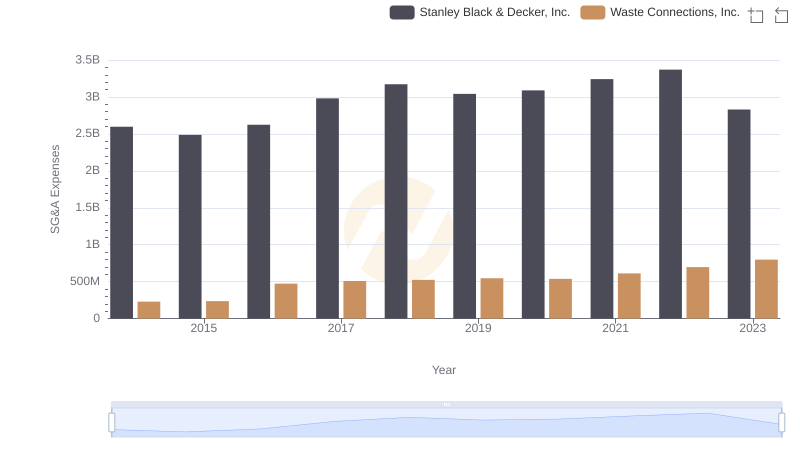
Breaking Down SG&A Expenses: Waste Connections, Inc. vs Stanley Black & Decker, Inc.
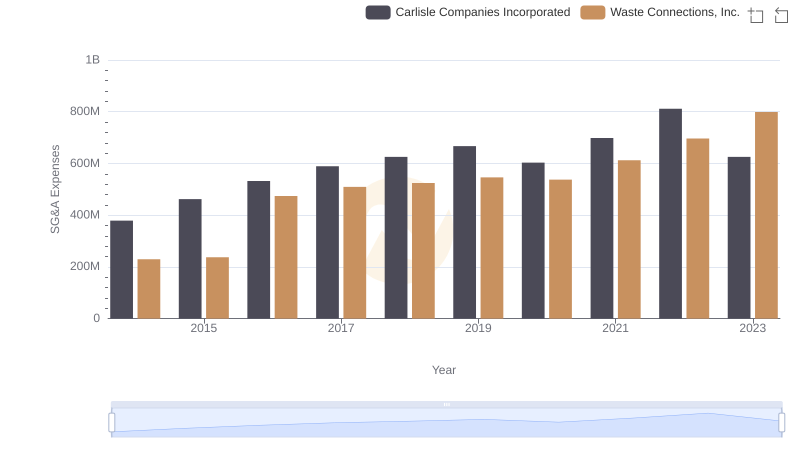
Selling, General, and Administrative Costs: Waste Connections, Inc. vs Carlisle Companies Incorporated
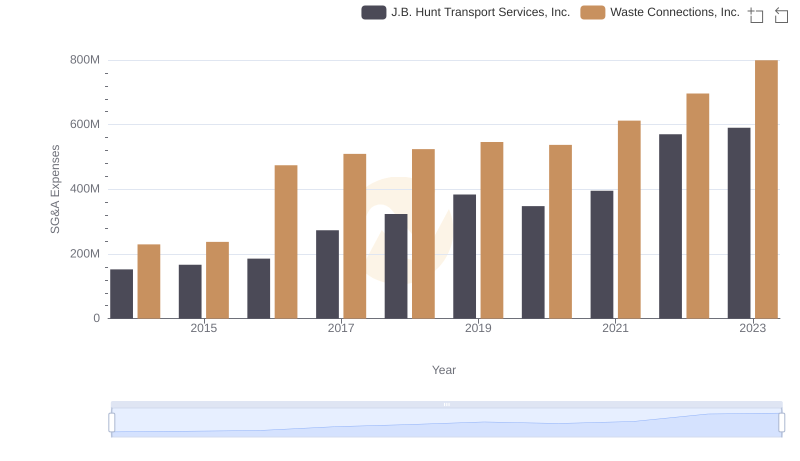
Cost Management Insights: SG&A Expenses for Waste Connections, Inc. and J.B. Hunt Transport Services, Inc.