| __timestamp | China Eastern Airlines Corporation Limited | Parker-Hannifin Corporation |
|---|---|---|
| Wednesday, January 1, 2014 | 4120000000 | 1633992000 |
| Thursday, January 1, 2015 | 3651000000 | 1544746000 |
| Friday, January 1, 2016 | 3133000000 | 1359360000 |
| Sunday, January 1, 2017 | 3294000000 | 1453935000 |
| Monday, January 1, 2018 | 3807000000 | 1657152000 |
| Tuesday, January 1, 2019 | 4134000000 | 1543939000 |
| Wednesday, January 1, 2020 | 1570000000 | 1656553000 |
| Friday, January 1, 2021 | 1128000000 | 1527302000 |
| Saturday, January 1, 2022 | 2933000000 | 1627116000 |
| Sunday, January 1, 2023 | 7254000000 | 3354103000 |
| Monday, January 1, 2024 | 3315177000 |
Unlocking the unknown
In the ever-evolving landscape of global business, understanding the financial strategies of industry giants is crucial. This analysis delves into the Selling, General, and Administrative (SG&A) expenses of Parker-Hannifin Corporation and China Eastern Airlines Corporation Limited from 2014 to 2023.
Parker-Hannifin, a leader in motion and control technologies, has shown a steady increase in SG&A expenses, peaking in 2023 with a 105% rise compared to 2014. This growth reflects strategic investments in innovation and market expansion.
Conversely, China Eastern Airlines experienced a volatile SG&A trend, with a significant dip in 2020, likely due to the pandemic's impact on the aviation industry. However, by 2023, their expenses surged by 75% from 2014, indicating a robust recovery and expansion strategy.
This comparative analysis highlights the diverse financial strategies employed by these corporations in response to global economic shifts.

Parker-Hannifin Corporation or China Eastern Airlines Corporation Limited: Who Leads in Yearly Revenue?
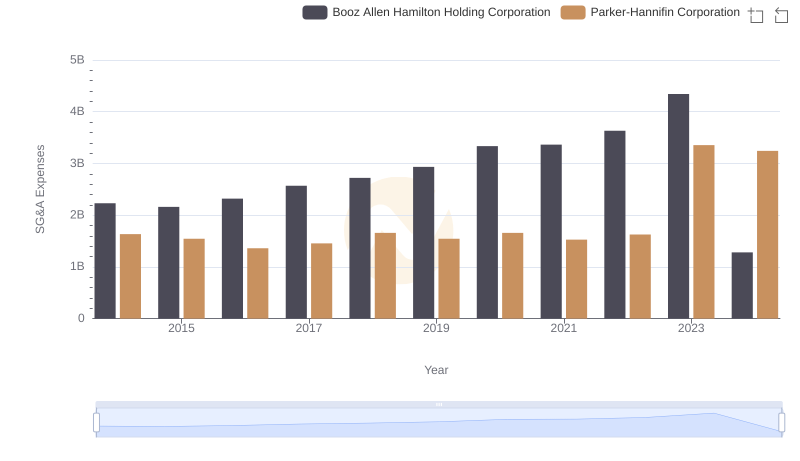
Breaking Down SG&A Expenses: Parker-Hannifin Corporation vs Booz Allen Hamilton Holding Corporation
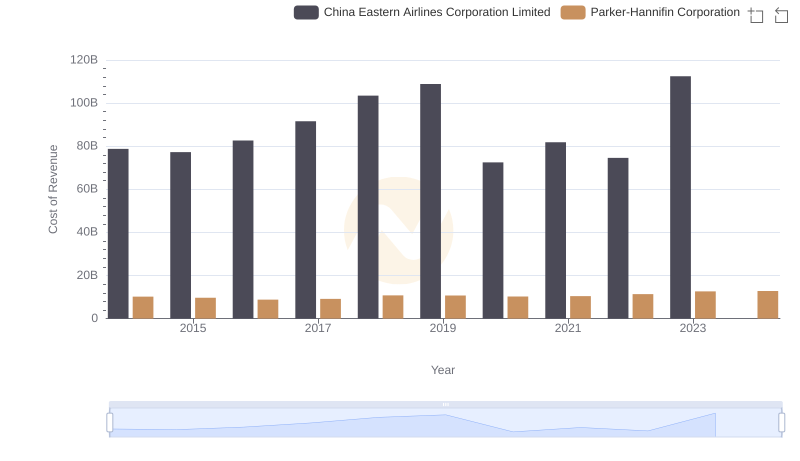
Cost of Revenue Trends: Parker-Hannifin Corporation vs China Eastern Airlines Corporation Limited
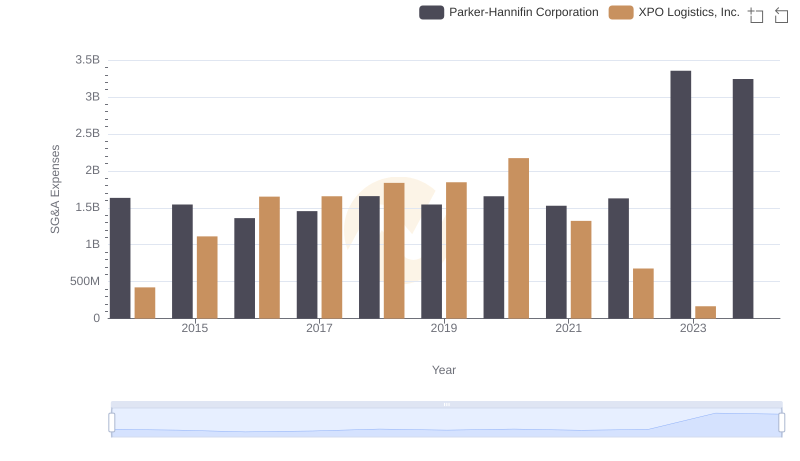
Parker-Hannifin Corporation vs XPO Logistics, Inc.: SG&A Expense Trends
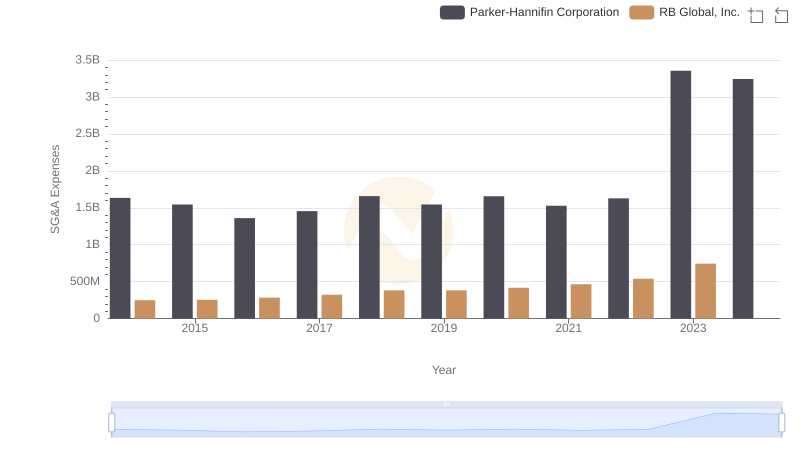
Breaking Down SG&A Expenses: Parker-Hannifin Corporation vs RB Global, Inc.
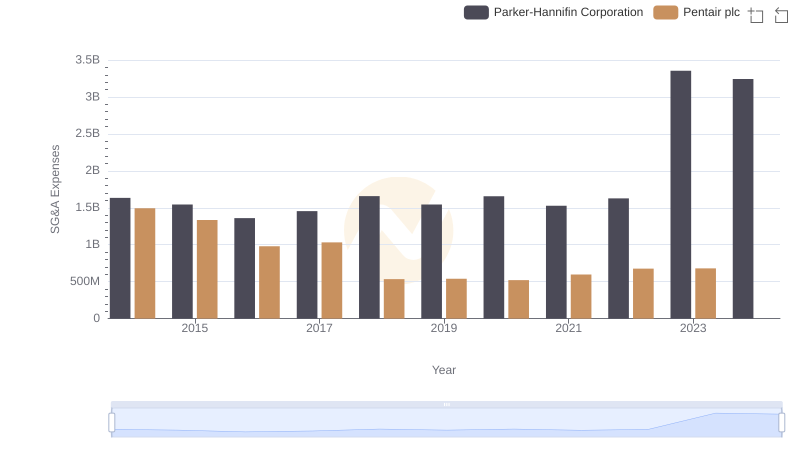
Who Optimizes SG&A Costs Better? Parker-Hannifin Corporation or Pentair plc
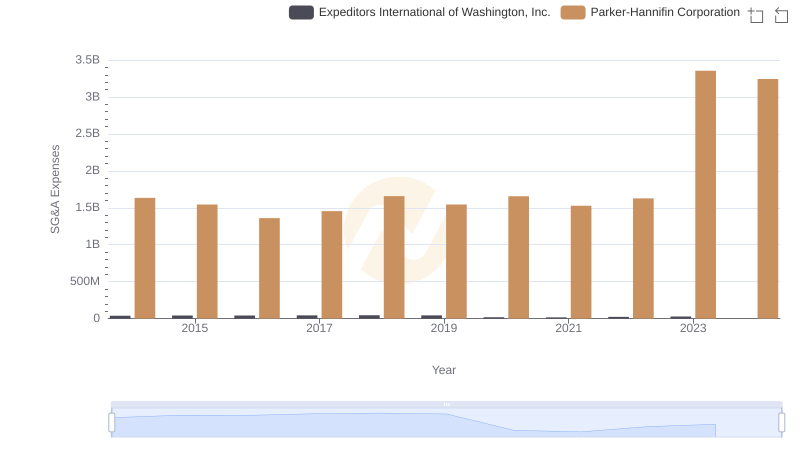
Who Optimizes SG&A Costs Better? Parker-Hannifin Corporation or Expeditors International of Washington, Inc.
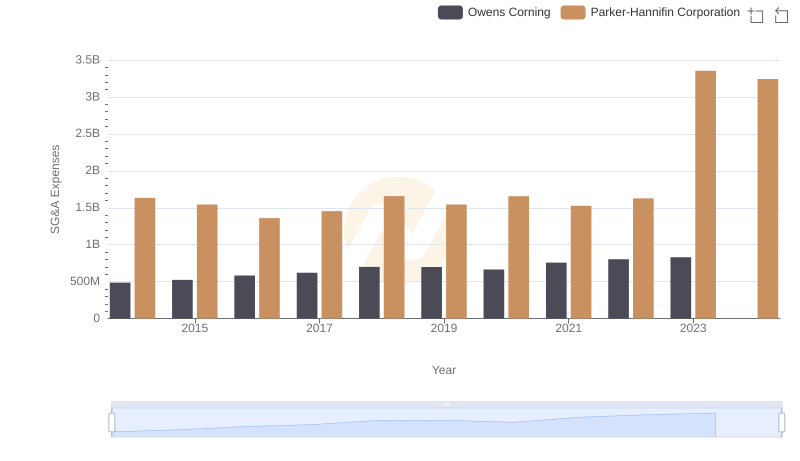
Operational Costs Compared: SG&A Analysis of Parker-Hannifin Corporation and Owens Corning
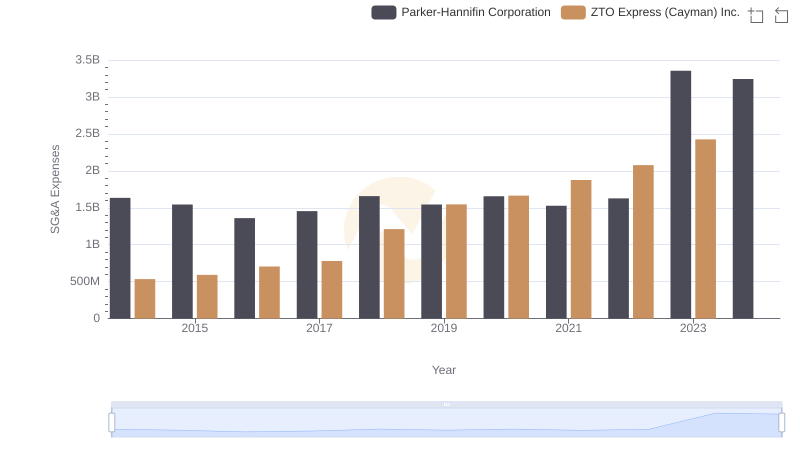
SG&A Efficiency Analysis: Comparing Parker-Hannifin Corporation and ZTO Express (Cayman) Inc.