| __timestamp | Analog Devices, Inc. | Dell Technologies Inc. |
|---|---|---|
| Wednesday, January 1, 2014 | 454676000 | 8906000000 |
| Thursday, January 1, 2015 | 478972000 | 8292000000 |
| Friday, January 1, 2016 | 461438000 | 7850000000 |
| Sunday, January 1, 2017 | 691046000 | 13403000000 |
| Monday, January 1, 2018 | 695937000 | 18569000000 |
| Tuesday, January 1, 2019 | 648094000 | 20640000000 |
| Wednesday, January 1, 2020 | 659923000 | 15819000000 |
| Friday, January 1, 2021 | 915418000 | 14000000000 |
| Saturday, January 1, 2022 | 1266175000 | 14655000000 |
| Sunday, January 1, 2023 | 1273584000 | 14136000000 |
| Monday, January 1, 2024 | 1068640000 | 12857000000 |
Unveiling the hidden dimensions of data
In the ever-evolving landscape of technology, understanding the financial strategies of industry giants is crucial. This analysis delves into the Selling, General, and Administrative (SG&A) expenses of Analog Devices, Inc. and Dell Technologies Inc. from 2014 to 2024. Over this decade, Dell consistently outspent Analog Devices, with SG&A expenses peaking at approximately $20.6 billion in 2019, nearly 16 times higher than Analog Devices' highest expenditure in 2023. Notably, Analog Devices saw a significant increase of over 180% in their SG&A expenses from 2014 to 2023, reflecting strategic investments in growth and innovation. Meanwhile, Dell's expenses fluctuated, indicating adaptive strategies in response to market dynamics. This financial narrative not only highlights the contrasting approaches of these tech titans but also underscores the broader economic trends influencing corporate spending.
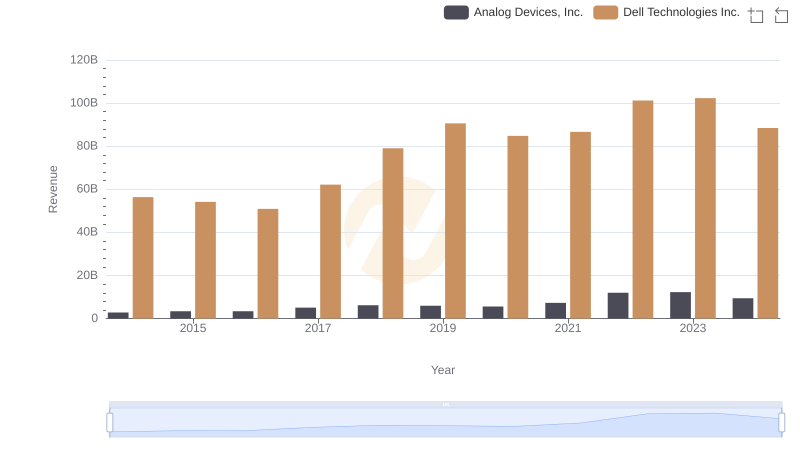
Analog Devices, Inc. and Dell Technologies Inc.: A Comprehensive Revenue Analysis
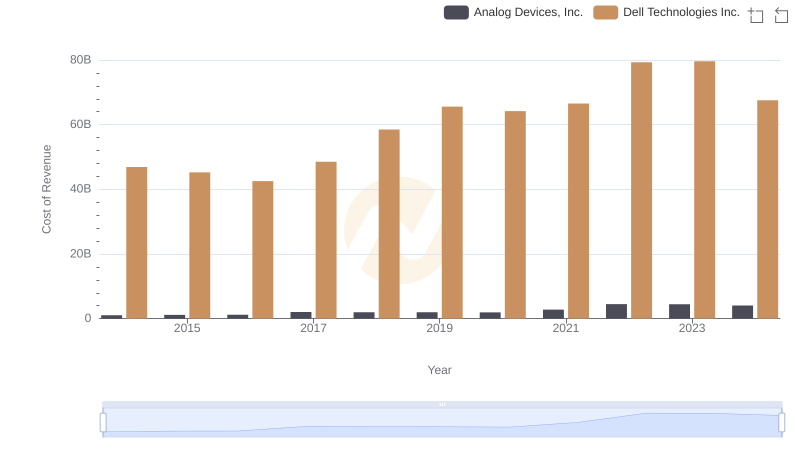
Cost of Revenue: Key Insights for Analog Devices, Inc. and Dell Technologies Inc.
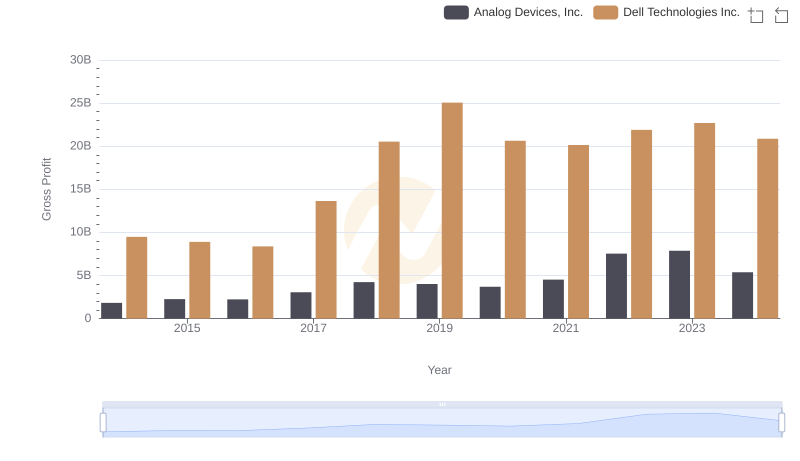
Gross Profit Comparison: Analog Devices, Inc. and Dell Technologies Inc. Trends
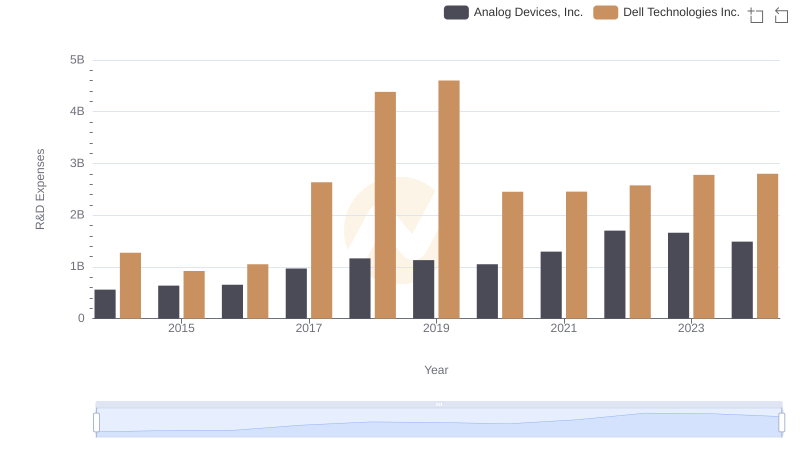
Research and Development: Comparing Key Metrics for Analog Devices, Inc. and Dell Technologies Inc.
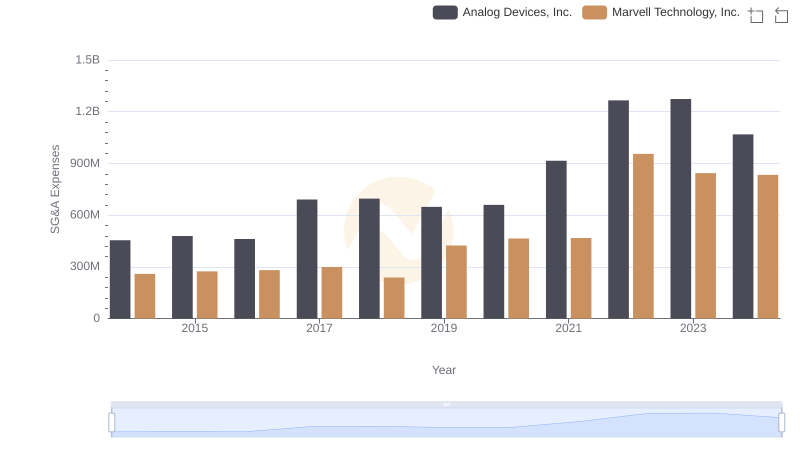
SG&A Efficiency Analysis: Comparing Analog Devices, Inc. and Marvell Technology, Inc.
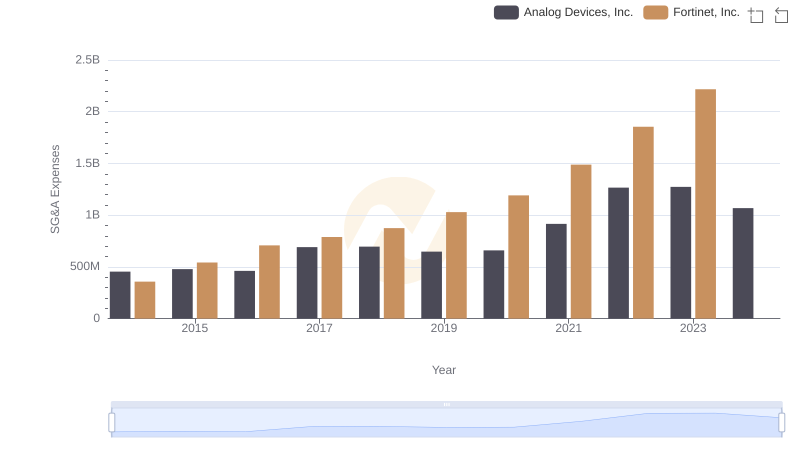
Operational Costs Compared: SG&A Analysis of Analog Devices, Inc. and Fortinet, Inc.
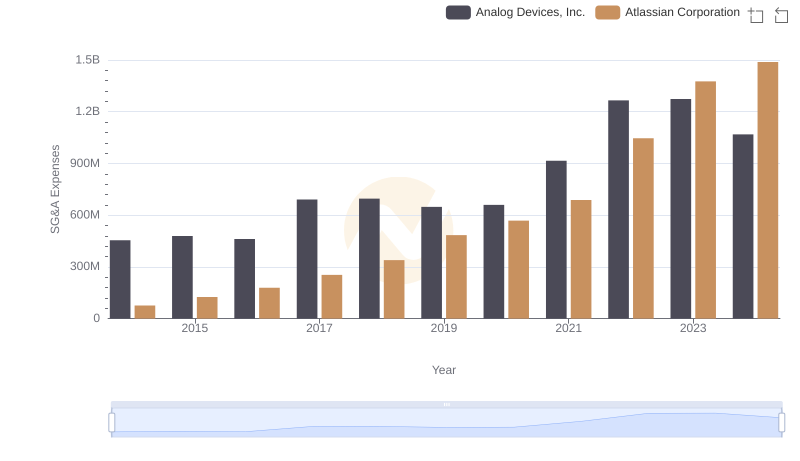
Selling, General, and Administrative Costs: Analog Devices, Inc. vs Atlassian Corporation
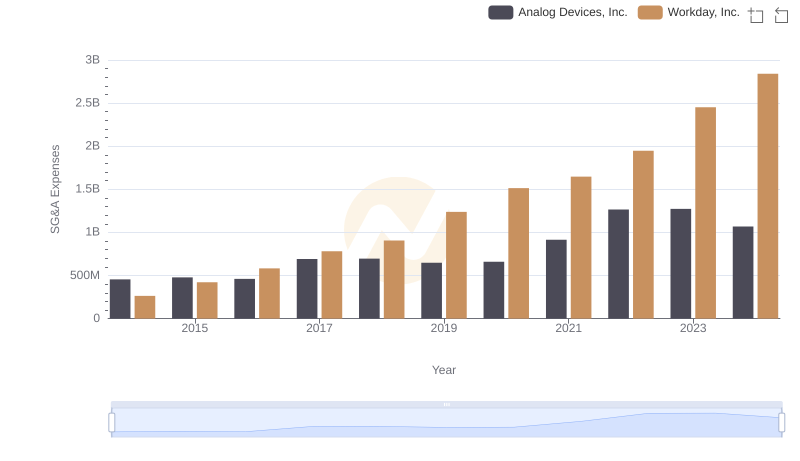
Cost Management Insights: SG&A Expenses for Analog Devices, Inc. and Workday, Inc.
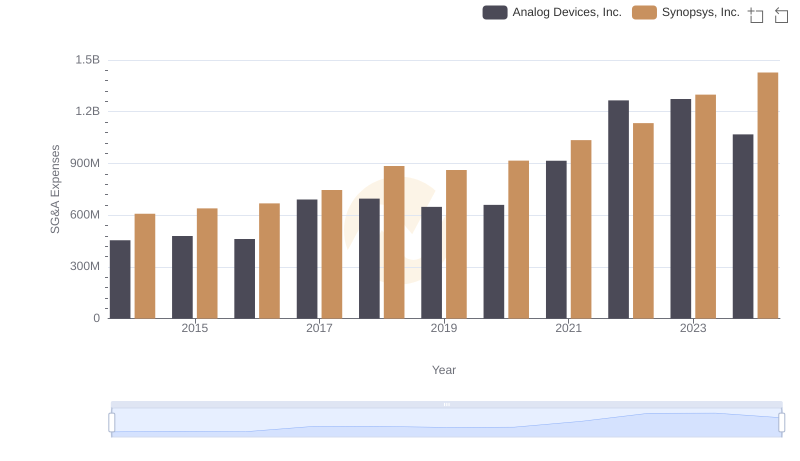
Analog Devices, Inc. vs Synopsys, Inc.: SG&A Expense Trends
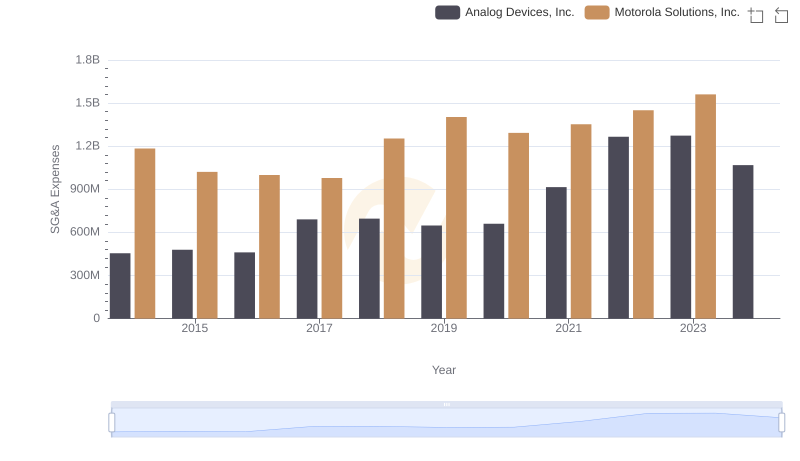
Cost Management Insights: SG&A Expenses for Analog Devices, Inc. and Motorola Solutions, Inc.
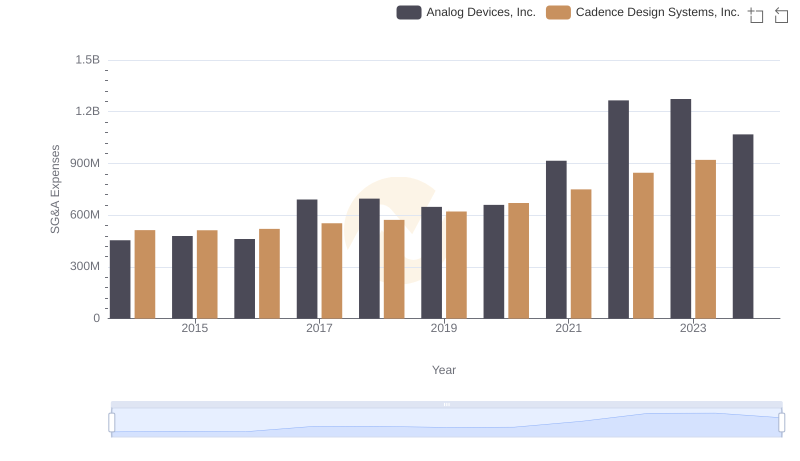
Who Optimizes SG&A Costs Better? Analog Devices, Inc. or Cadence Design Systems, Inc.
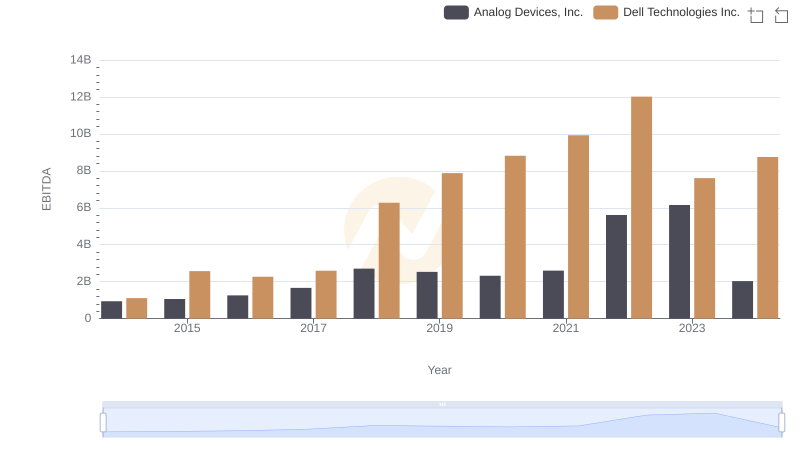
Analog Devices, Inc. vs Dell Technologies Inc.: In-Depth EBITDA Performance Comparison