| __timestamp | Analog Devices, Inc. | Synopsys, Inc. |
|---|---|---|
| Wednesday, January 1, 2014 | 454676000 | 608294000 |
| Thursday, January 1, 2015 | 478972000 | 639504000 |
| Friday, January 1, 2016 | 461438000 | 668330000 |
| Sunday, January 1, 2017 | 691046000 | 746092000 |
| Monday, January 1, 2018 | 695937000 | 885538000 |
| Tuesday, January 1, 2019 | 648094000 | 862108000 |
| Wednesday, January 1, 2020 | 659923000 | 916540000 |
| Friday, January 1, 2021 | 915418000 | 1035479000 |
| Saturday, January 1, 2022 | 1266175000 | 1133617000 |
| Sunday, January 1, 2023 | 1273584000 | 1299327000 |
| Monday, January 1, 2024 | 1068640000 | 1427838000 |
Infusing magic into the data realm
In the ever-evolving landscape of technology, understanding the financial strategies of industry leaders is crucial. This analysis delves into the Selling, General, and Administrative (SG&A) expenses of Analog Devices, Inc. and Synopsys, Inc. from 2014 to 2024. Over this decade, Synopsys consistently outpaced Analog Devices in SG&A spending, reflecting a strategic emphasis on operational expansion and market penetration. Notably, Synopsys's SG&A expenses surged by approximately 135% from 2014 to 2024, peaking in 2024. In contrast, Analog Devices saw a more modest increase of around 135% over the same period, with a significant spike in 2022. This divergence highlights differing corporate strategies: while Synopsys invests heavily in growth, Analog Devices maintains a more conservative approach. These trends offer valuable insights into how these tech titans allocate resources to sustain competitive advantage in a dynamic market.
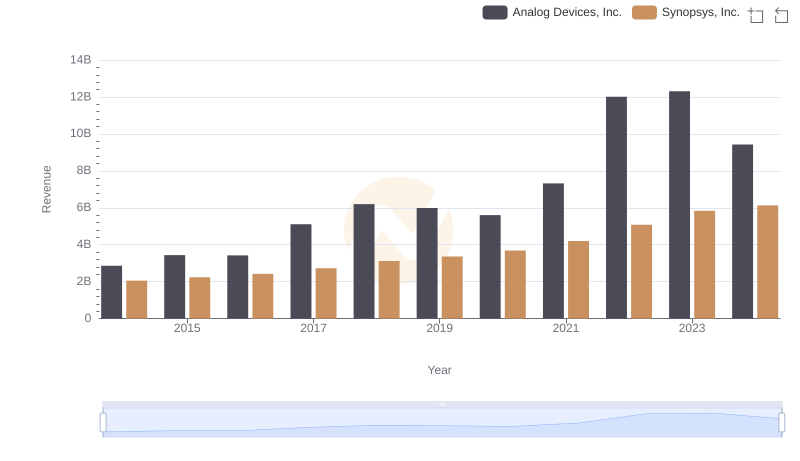
Annual Revenue Comparison: Analog Devices, Inc. vs Synopsys, Inc.
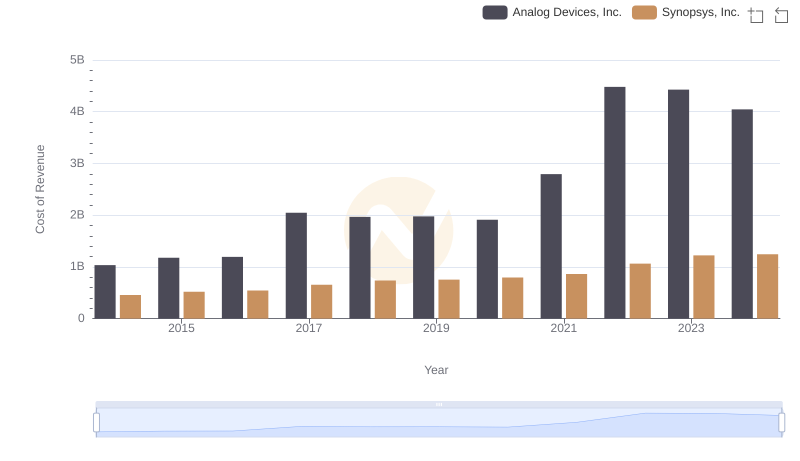
Analog Devices, Inc. vs Synopsys, Inc.: Efficiency in Cost of Revenue Explored
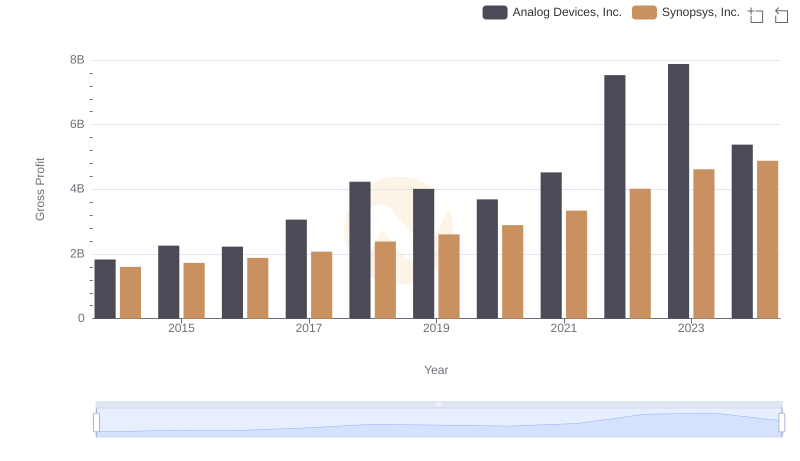
Key Insights on Gross Profit: Analog Devices, Inc. vs Synopsys, Inc.
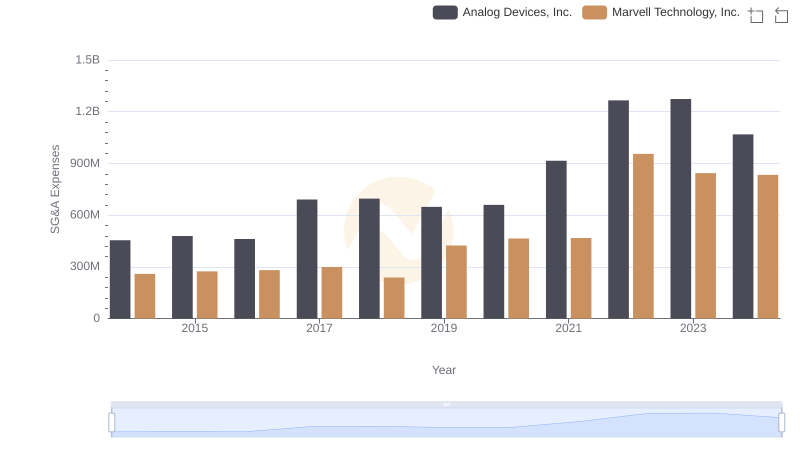
SG&A Efficiency Analysis: Comparing Analog Devices, Inc. and Marvell Technology, Inc.
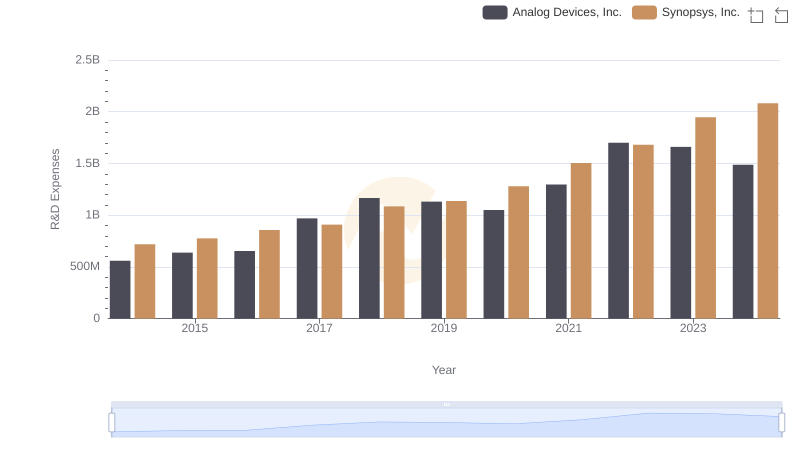
Research and Development Investment: Analog Devices, Inc. vs Synopsys, Inc.
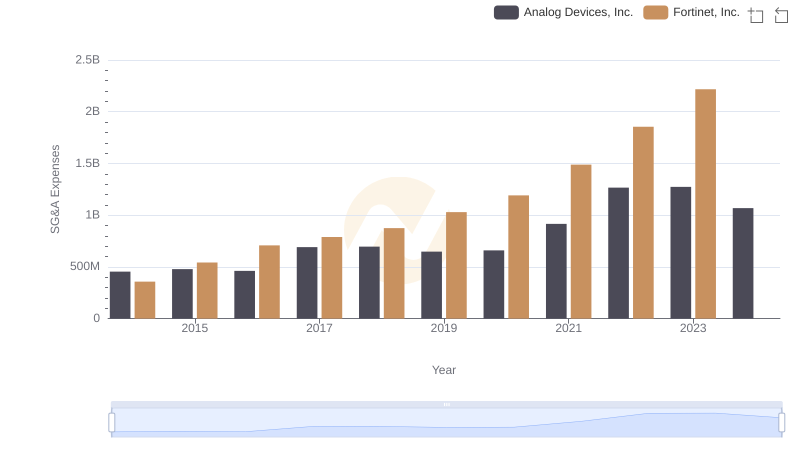
Operational Costs Compared: SG&A Analysis of Analog Devices, Inc. and Fortinet, Inc.
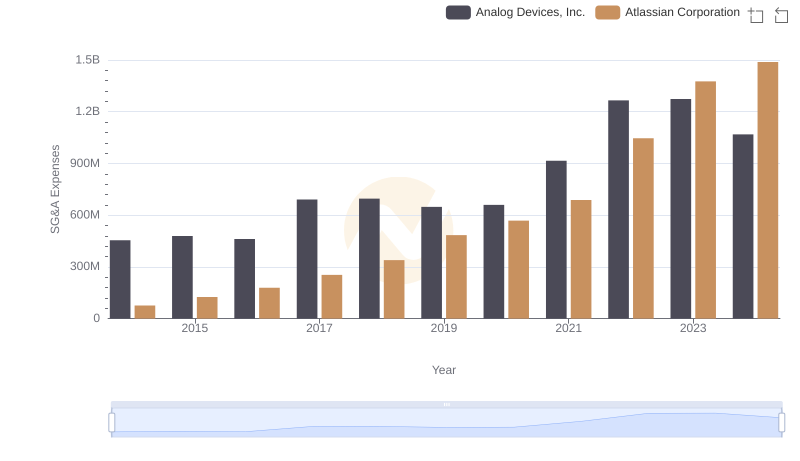
Selling, General, and Administrative Costs: Analog Devices, Inc. vs Atlassian Corporation
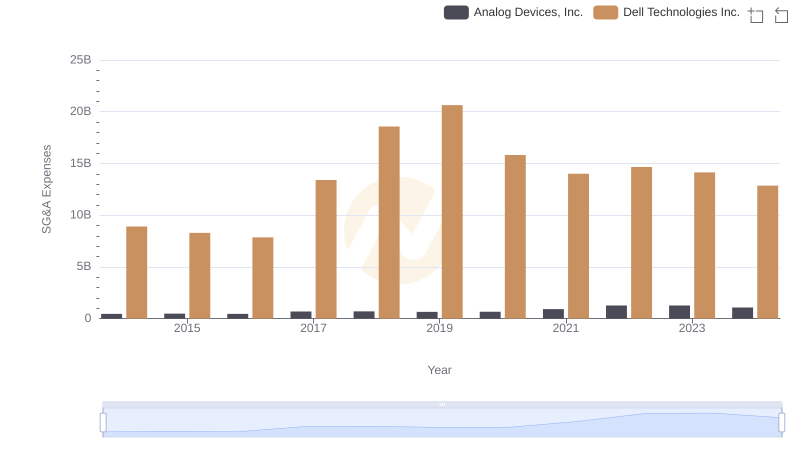
Breaking Down SG&A Expenses: Analog Devices, Inc. vs Dell Technologies Inc.
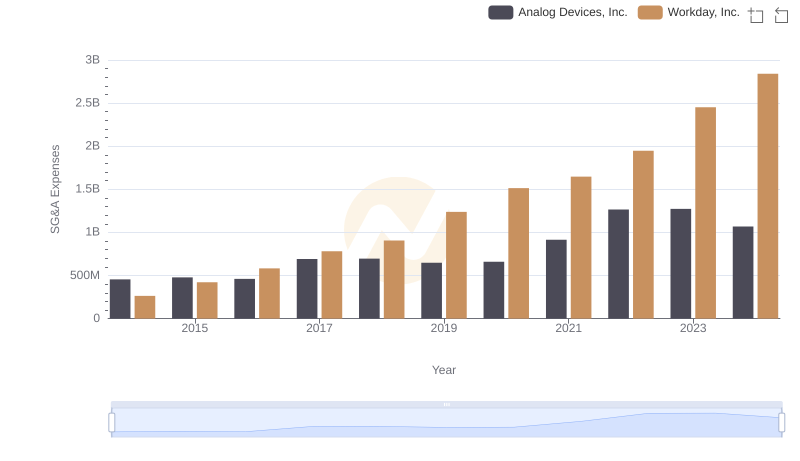
Cost Management Insights: SG&A Expenses for Analog Devices, Inc. and Workday, Inc.
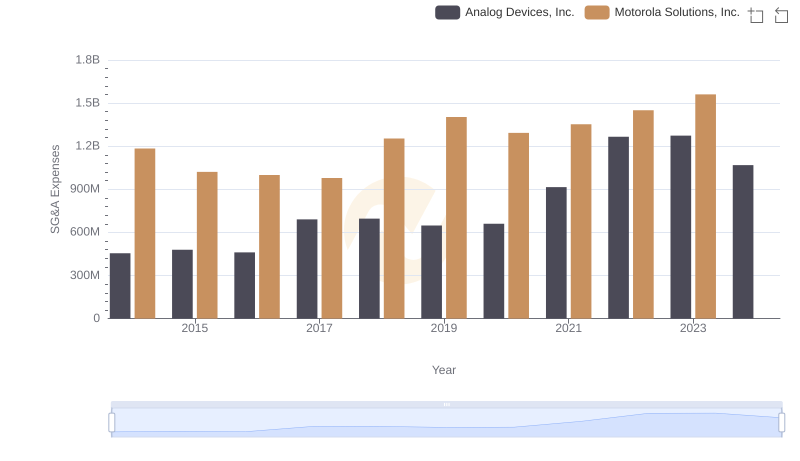
Cost Management Insights: SG&A Expenses for Analog Devices, Inc. and Motorola Solutions, Inc.
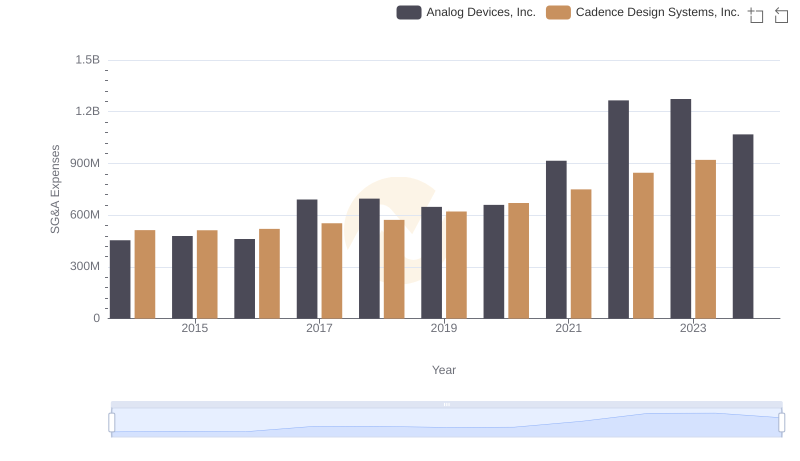
Who Optimizes SG&A Costs Better? Analog Devices, Inc. or Cadence Design Systems, Inc.
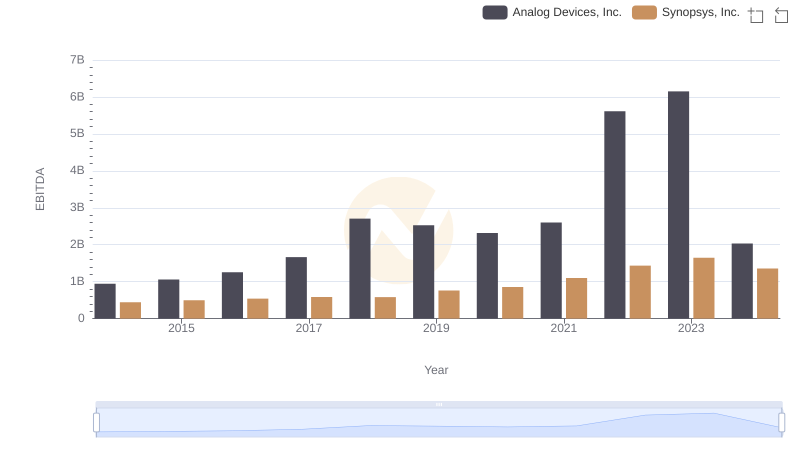
A Professional Review of EBITDA: Analog Devices, Inc. Compared to Synopsys, Inc.