| __timestamp | Automatic Data Processing, Inc. | Masco Corporation |
|---|---|---|
| Wednesday, January 1, 2014 | 7221400000 | 6134000000 |
| Thursday, January 1, 2015 | 6427600000 | 4889000000 |
| Friday, January 1, 2016 | 6840300000 | 4901000000 |
| Sunday, January 1, 2017 | 7269800000 | 5033000000 |
| Monday, January 1, 2018 | 7842600000 | 5670000000 |
| Tuesday, January 1, 2019 | 8086600000 | 4336000000 |
| Wednesday, January 1, 2020 | 8445100000 | 4601000000 |
| Friday, January 1, 2021 | 8640300000 | 5512000000 |
| Saturday, January 1, 2022 | 9461900000 | 5967000000 |
| Sunday, January 1, 2023 | 9953400000 | 5131000000 |
| Monday, January 1, 2024 | 10476700000 | 4997000000 |
Unlocking the unknown
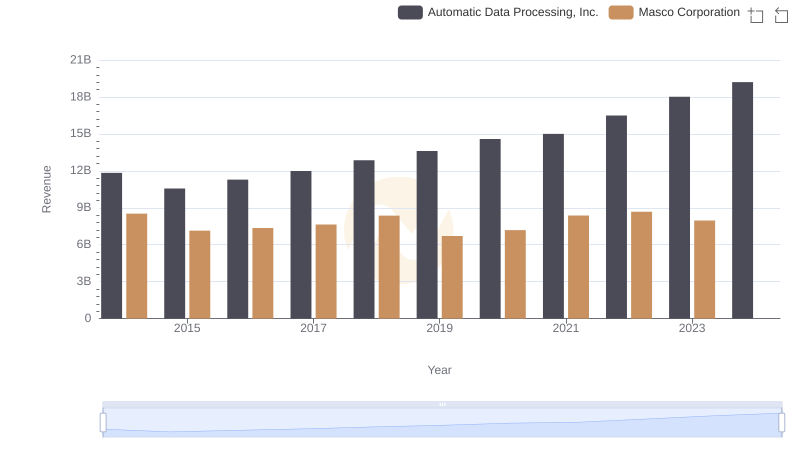
In the ever-evolving landscape of corporate finance, understanding cost structures is crucial. This analysis delves into the cost of revenue trends for Automatic Data Processing, Inc. (ADP) and Masco Corporation from 2014 to 2023. Over this decade, ADP's cost of revenue has shown a steady upward trajectory, increasing by approximately 45%, from $7.2 billion in 2014 to an impressive $10.5 billion in 2023. This growth reflects ADP's expanding operations and market reach.
Conversely, Masco Corporation's cost of revenue has experienced fluctuations, peaking at $6.1 billion in 2014 and then stabilizing around $5 billion in recent years. This indicates a strategic shift towards efficiency and cost management. Notably, data for 2024 is incomplete, highlighting the dynamic nature of financial reporting.
These insights underscore the importance of cost management in sustaining competitive advantage in today's business environment.
Automatic Data Processing, Inc. vs Masco Corporation: Examining Key Revenue Metrics

Cost Insights: Breaking Down Automatic Data Processing, Inc. and TransUnion's Expenses
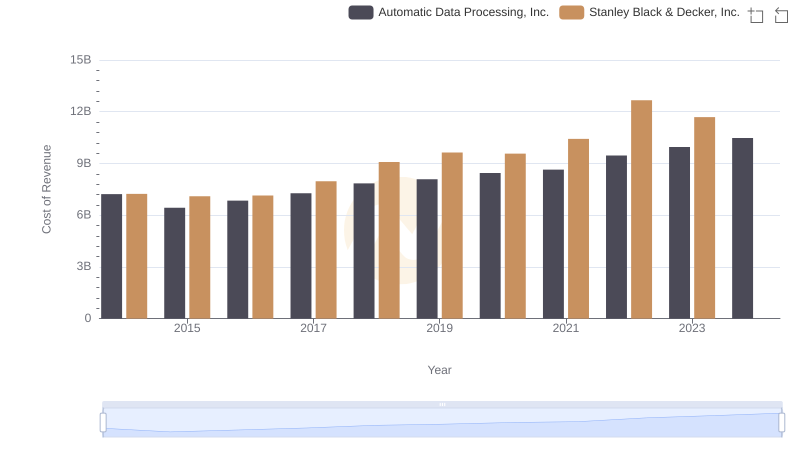
Automatic Data Processing, Inc. vs Stanley Black & Decker, Inc.: Efficiency in Cost of Revenue Explored
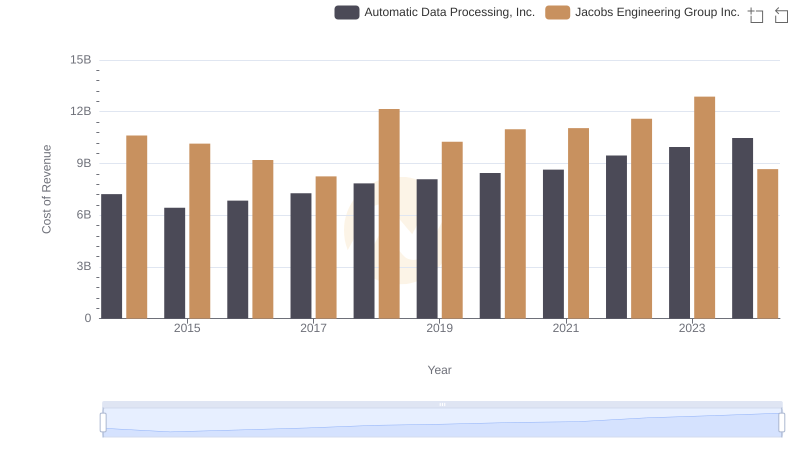
Automatic Data Processing, Inc. vs Jacobs Engineering Group Inc.: Efficiency in Cost of Revenue Explored
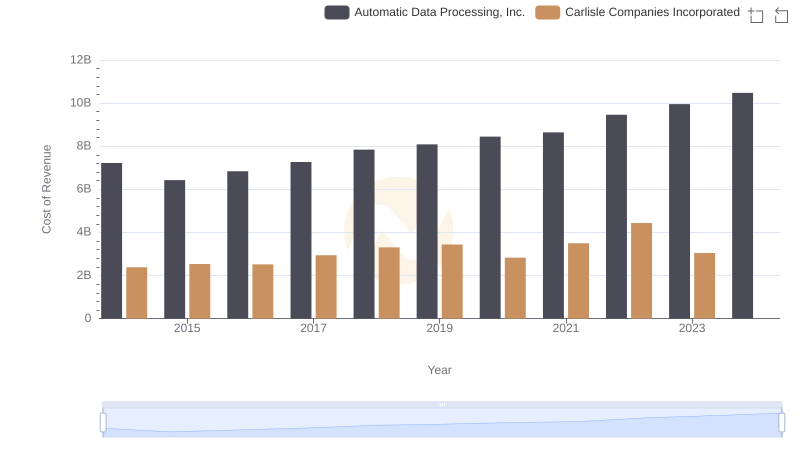
Cost of Revenue: Key Insights for Automatic Data Processing, Inc. and Carlisle Companies Incorporated
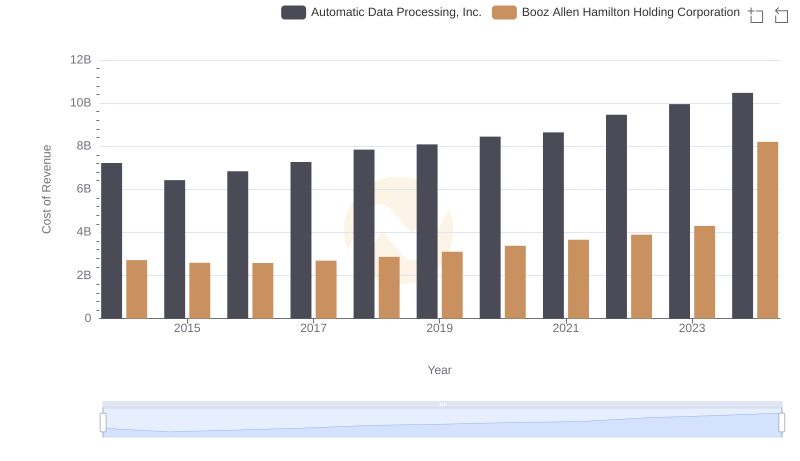
Automatic Data Processing, Inc. vs Booz Allen Hamilton Holding Corporation: Efficiency in Cost of Revenue Explored

Operational Costs Compared: SG&A Analysis of Automatic Data Processing, Inc. and Masco Corporation