| __timestamp | Automatic Data Processing, Inc. | Carlisle Companies Incorporated |
|---|---|---|
| Wednesday, January 1, 2014 | 7221400000 | 2384500000 |
| Thursday, January 1, 2015 | 6427600000 | 2536500000 |
| Friday, January 1, 2016 | 6840300000 | 2518100000 |
| Sunday, January 1, 2017 | 7269800000 | 2941900000 |
| Monday, January 1, 2018 | 7842600000 | 3304800000 |
| Tuesday, January 1, 2019 | 8086600000 | 3439900000 |
| Wednesday, January 1, 2020 | 8445100000 | 2832500000 |
| Friday, January 1, 2021 | 8640300000 | 3495600000 |
| Saturday, January 1, 2022 | 9461900000 | 4434500000 |
| Sunday, January 1, 2023 | 9953400000 | 3042900000 |
| Monday, January 1, 2024 | 10476700000 | 3115900000 |
Unleashing insights
In the ever-evolving landscape of corporate finance, understanding the cost of revenue is crucial for evaluating a company's operational efficiency. This analysis focuses on Automatic Data Processing, Inc. (ADP) and Carlisle Companies Incorporated, two giants in their respective industries. Over the past decade, ADP has consistently increased its cost of revenue, peaking at approximately $10.5 billion in 2024, marking a 45% rise since 2014. In contrast, Carlisle Companies saw a more modest increase, with a peak in 2022 at around $4.4 billion, before a notable decline in 2023. This divergence highlights the different strategic approaches of these companies, with ADP's steady growth reflecting its expanding service offerings, while Carlisle's fluctuations may indicate market challenges or strategic shifts. Missing data for Carlisle in 2024 suggests potential reporting delays or strategic changes, warranting further investigation.
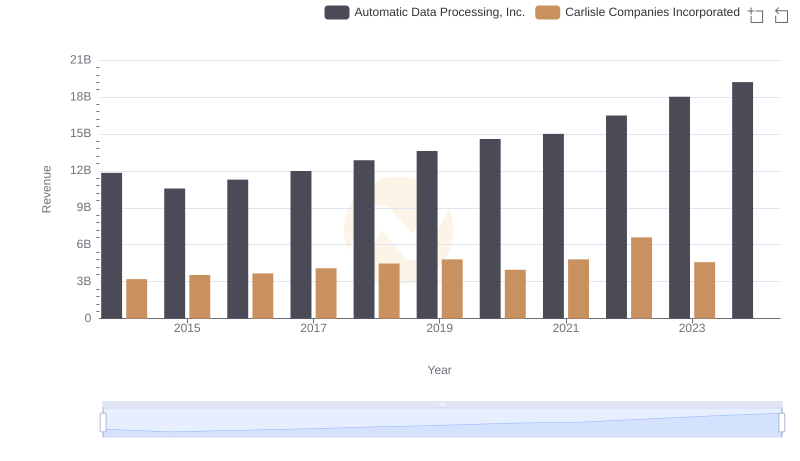
Automatic Data Processing, Inc. vs Carlisle Companies Incorporated: Examining Key Revenue Metrics
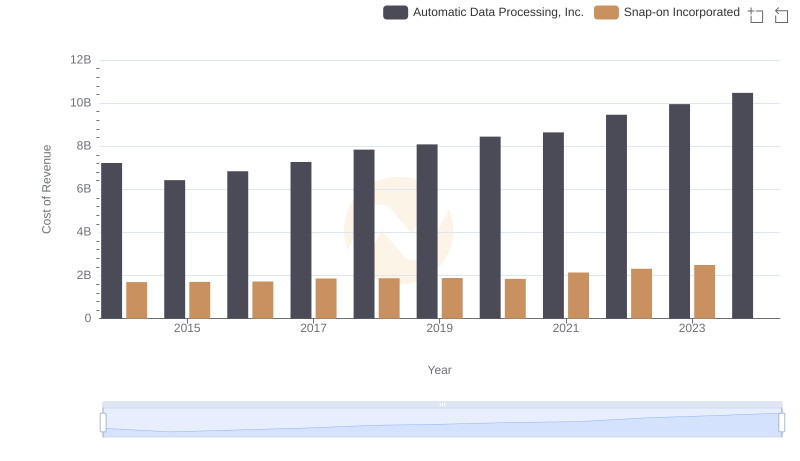
Cost of Revenue: Key Insights for Automatic Data Processing, Inc. and Snap-on Incorporated

Cost Insights: Breaking Down Automatic Data Processing, Inc. and TransUnion's Expenses
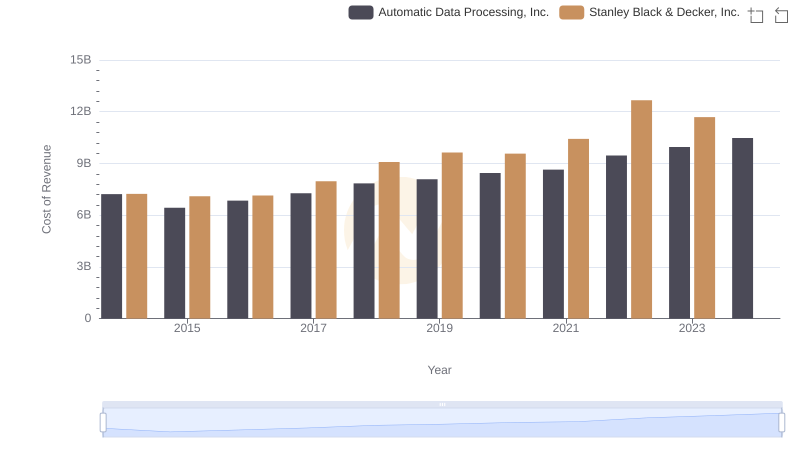
Automatic Data Processing, Inc. vs Stanley Black & Decker, Inc.: Efficiency in Cost of Revenue Explored
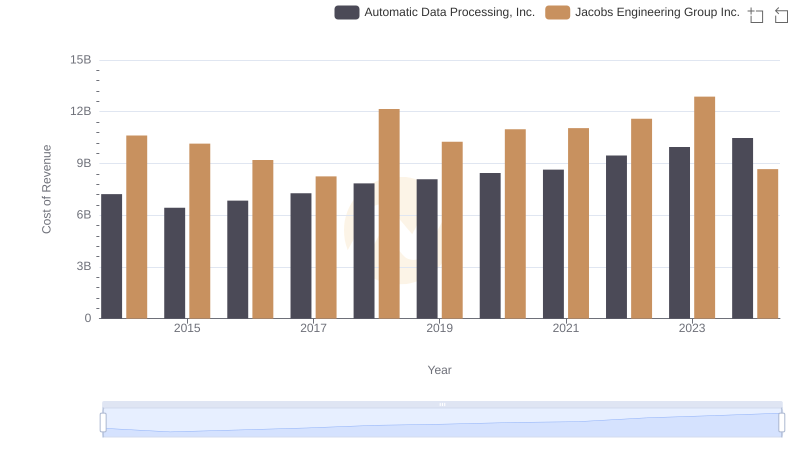
Automatic Data Processing, Inc. vs Jacobs Engineering Group Inc.: Efficiency in Cost of Revenue Explored
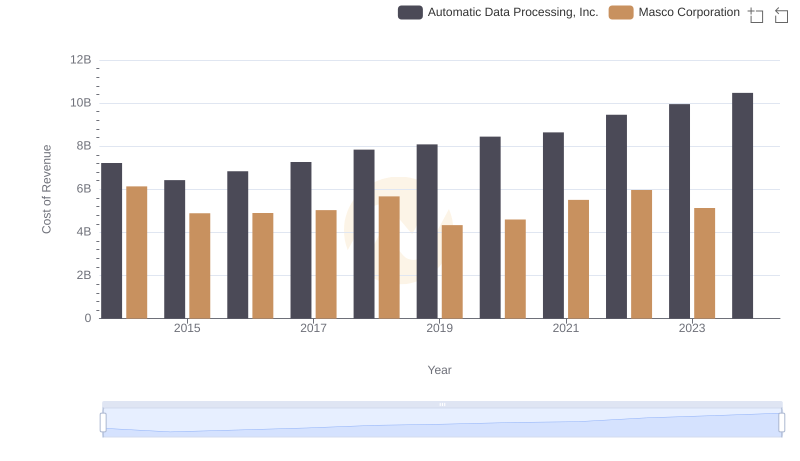
Cost of Revenue Trends: Automatic Data Processing, Inc. vs Masco Corporation
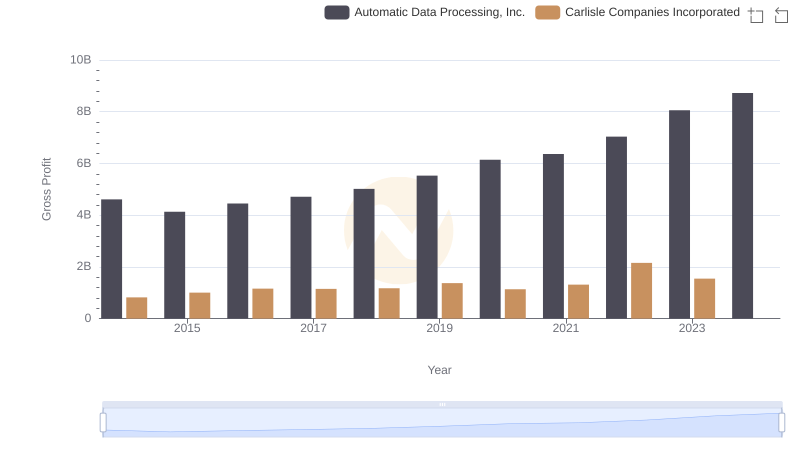
Who Generates Higher Gross Profit? Automatic Data Processing, Inc. or Carlisle Companies Incorporated
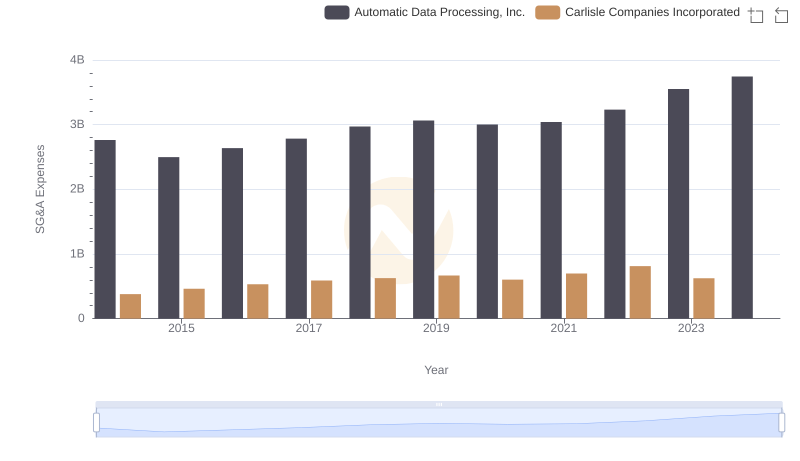
Automatic Data Processing, Inc. and Carlisle Companies Incorporated: SG&A Spending Patterns Compared
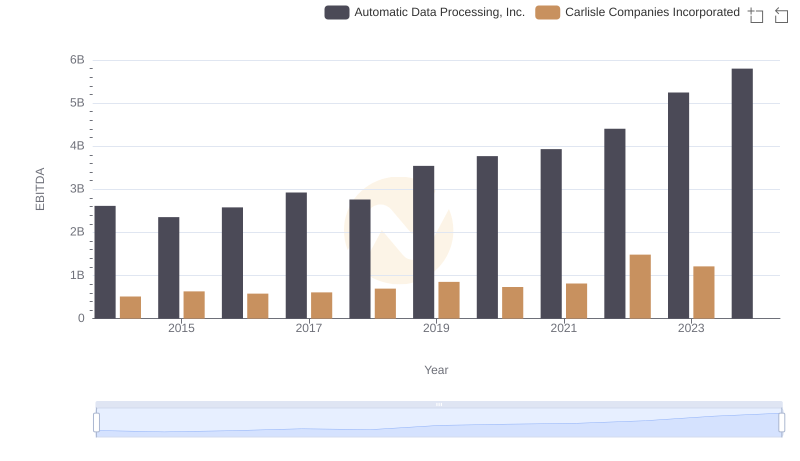
EBITDA Analysis: Evaluating Automatic Data Processing, Inc. Against Carlisle Companies Incorporated