| __timestamp | Axon Enterprise, Inc. | United Airlines Holdings, Inc. |
|---|---|---|
| Wednesday, January 1, 2014 | 164525000 | 38901000000 |
| Thursday, January 1, 2015 | 197892000 | 37864000000 |
| Friday, January 1, 2016 | 268245000 | 36556000000 |
| Sunday, January 1, 2017 | 343798000 | 37736000000 |
| Monday, January 1, 2018 | 420068000 | 41303000000 |
| Tuesday, January 1, 2019 | 530860000 | 43259000000 |
| Wednesday, January 1, 2020 | 681003000 | 15355000000 |
| Friday, January 1, 2021 | 863381000 | 24634000000 |
| Saturday, January 1, 2022 | 1189935000 | 44955000000 |
| Sunday, January 1, 2023 | 1563391000 | 53717000000 |
| Monday, January 1, 2024 | 57063000000 |
In pursuit of knowledge
In the ever-evolving landscape of American business, few stories are as compelling as the contrasting trajectories of Axon Enterprise, Inc. and United Airlines Holdings, Inc. Over the past decade, Axon, a leader in public safety technology, has seen its revenue soar by nearly 850%, reflecting a growing demand for its innovative solutions. In 2014, Axon's revenue was a modest 164 million, but by 2023, it had surged to over 1.56 billion.
Meanwhile, United Airlines, a titan of the aviation industry, has experienced a more turbulent journey. Despite a significant dip in 2020, when revenue plummeted to just 15% of its 2019 peak due to the global pandemic, United has rebounded impressively. By 2023, its revenue had climbed back to 53.7 billion, showcasing the resilience of the airline industry. This comparison highlights the dynamic nature of these two distinct sectors.
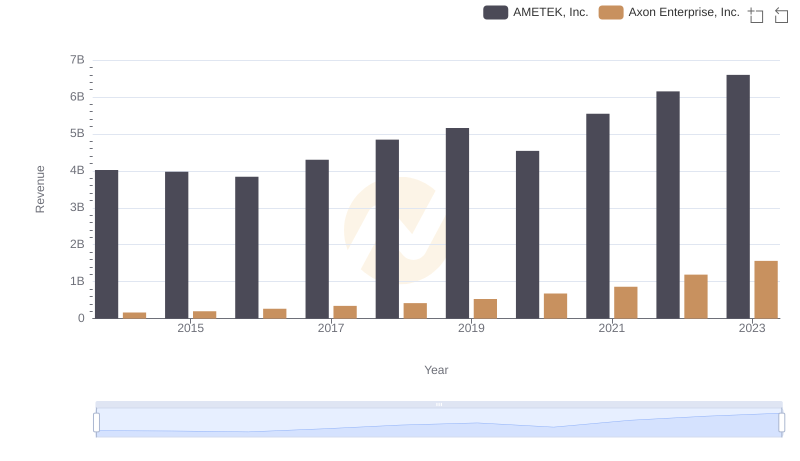
Annual Revenue Comparison: Axon Enterprise, Inc. vs AMETEK, Inc.
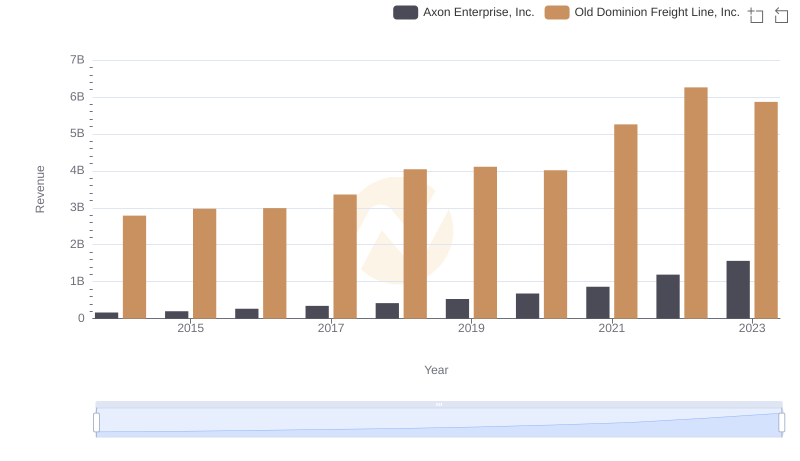
Comparing Revenue Performance: Axon Enterprise, Inc. or Old Dominion Freight Line, Inc.?
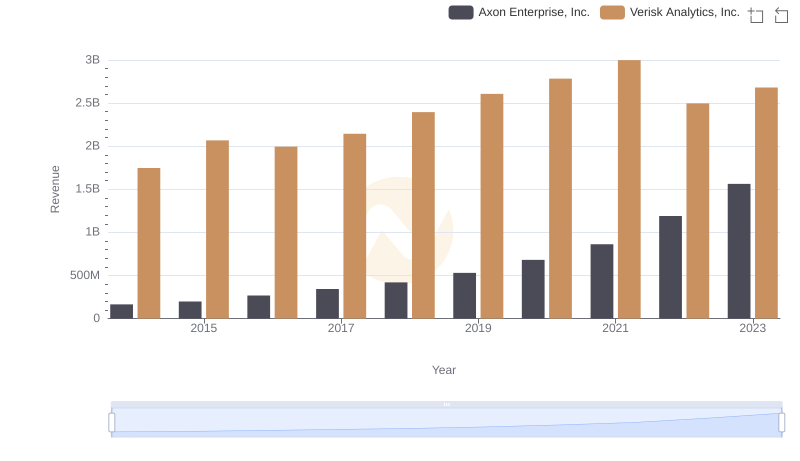
Axon Enterprise, Inc. or Verisk Analytics, Inc.: Who Leads in Yearly Revenue?
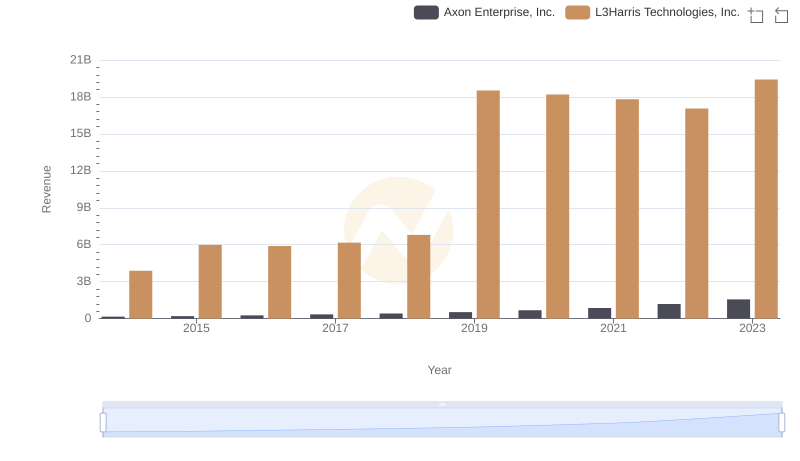
Annual Revenue Comparison: Axon Enterprise, Inc. vs L3Harris Technologies, Inc.

Axon Enterprise, Inc. vs Ingersoll Rand Inc.: Annual Revenue Growth Compared

Who Generates More Revenue? Axon Enterprise, Inc. or Ferguson plc
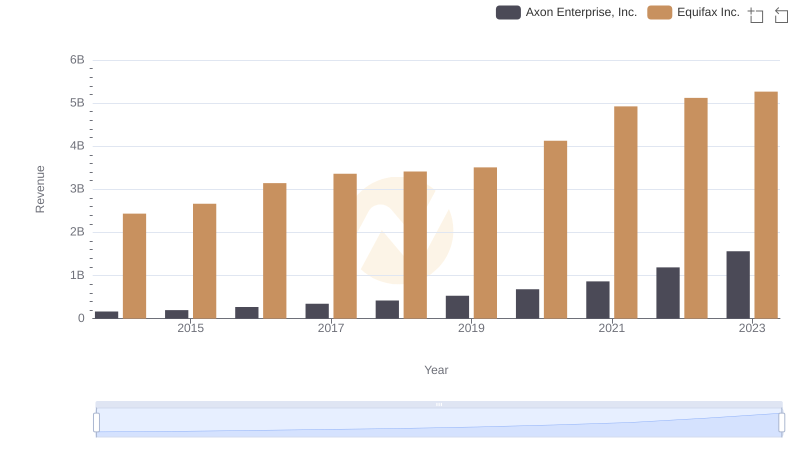
Annual Revenue Comparison: Axon Enterprise, Inc. vs Equifax Inc.
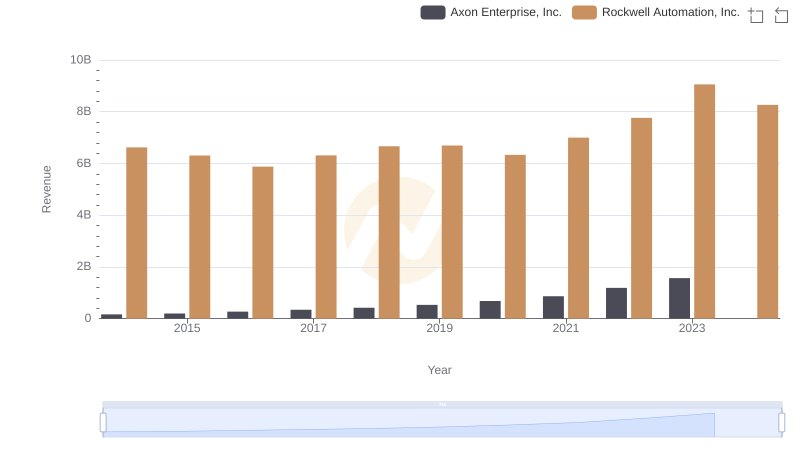
Axon Enterprise, Inc. vs Rockwell Automation, Inc.: Annual Revenue Growth Compared
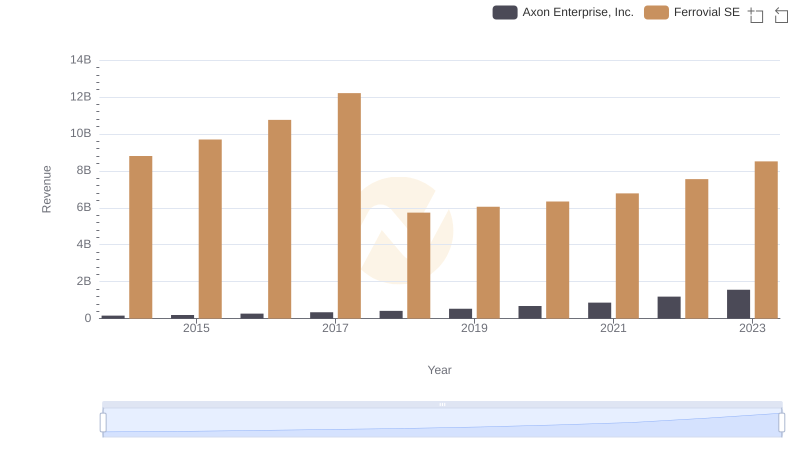
Who Generates More Revenue? Axon Enterprise, Inc. or Ferrovial SE