| __timestamp | Axon Enterprise, Inc. | Ingersoll Rand Inc. |
|---|---|---|
| Wednesday, January 1, 2014 | 164525000 | 2570005000 |
| Thursday, January 1, 2015 | 197892000 | 2126900000 |
| Friday, January 1, 2016 | 268245000 | 1939436000 |
| Sunday, January 1, 2017 | 343798000 | 2375400000 |
| Monday, January 1, 2018 | 420068000 | 2689800000 |
| Tuesday, January 1, 2019 | 530860000 | 2451900000 |
| Wednesday, January 1, 2020 | 681003000 | 4910200000 |
| Friday, January 1, 2021 | 863381000 | 5152400000 |
| Saturday, January 1, 2022 | 1189935000 | 5916300000 |
| Sunday, January 1, 2023 | 1563391000 | 6876100000 |
| Monday, January 1, 2024 | 0 |
Infusing magic into the data realm
In the ever-evolving landscape of industrial and technology sectors, Axon Enterprise, Inc. and Ingersoll Rand Inc. have showcased remarkable revenue trajectories over the past decade. From 2014 to 2023, Axon Enterprise, Inc. has seen its revenue grow nearly tenfold, from approximately $165 million to over $1.56 billion. This represents an impressive annual growth rate of around 30%, highlighting its dynamic expansion in the tech-driven public safety market.
Conversely, Ingersoll Rand Inc., a stalwart in the industrial sector, has demonstrated steady growth, with revenues increasing from $2.57 billion in 2014 to nearly $6.88 billion in 2023. This growth, averaging about 10% annually, underscores its resilience and adaptability in a competitive market.
These trends reflect broader industry shifts, with Axon capitalizing on technological advancements and Ingersoll Rand leveraging its industrial expertise to maintain a robust market presence.
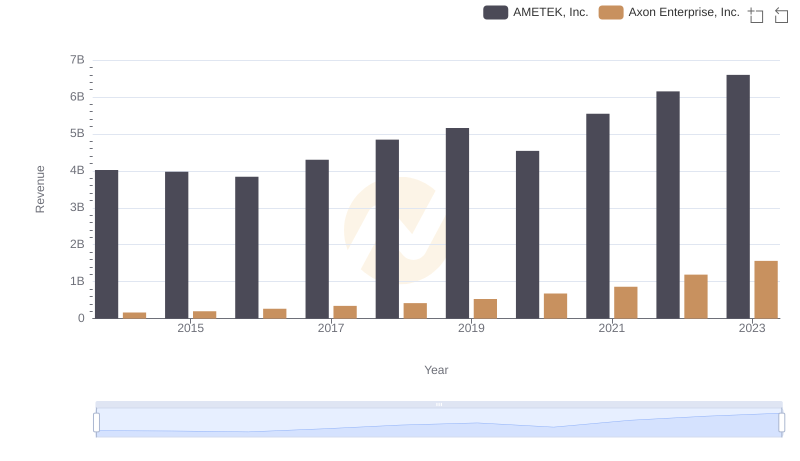
Annual Revenue Comparison: Axon Enterprise, Inc. vs AMETEK, Inc.
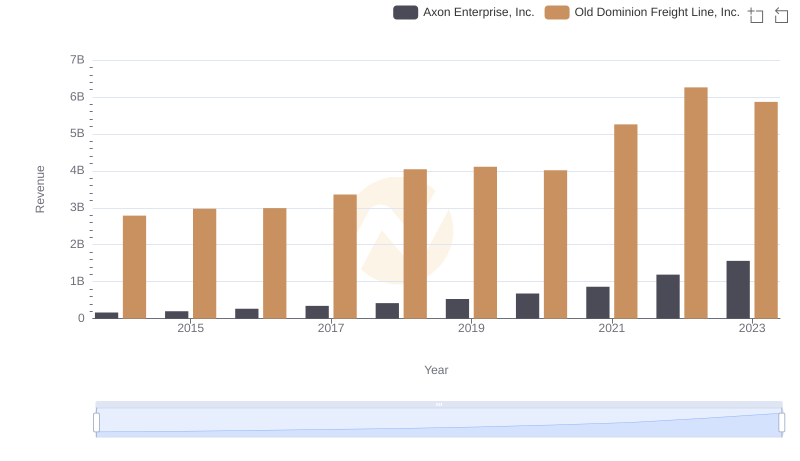
Comparing Revenue Performance: Axon Enterprise, Inc. or Old Dominion Freight Line, Inc.?
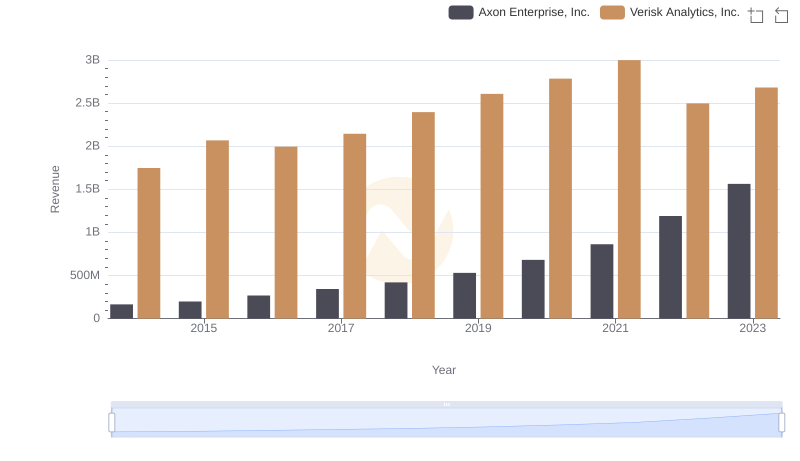
Axon Enterprise, Inc. or Verisk Analytics, Inc.: Who Leads in Yearly Revenue?
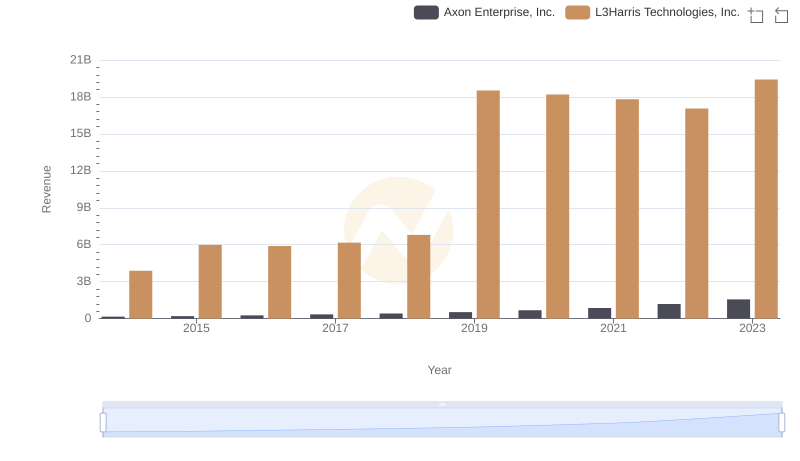
Annual Revenue Comparison: Axon Enterprise, Inc. vs L3Harris Technologies, Inc.

Who Generates More Revenue? Axon Enterprise, Inc. or Ferguson plc
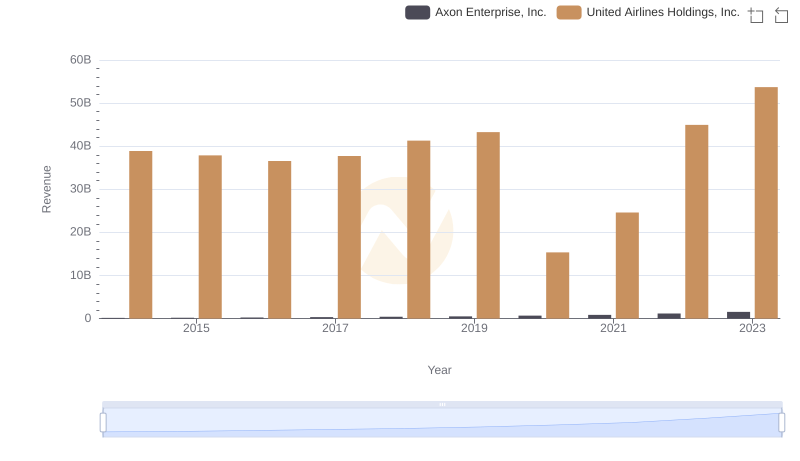
Annual Revenue Comparison: Axon Enterprise, Inc. vs United Airlines Holdings, Inc.
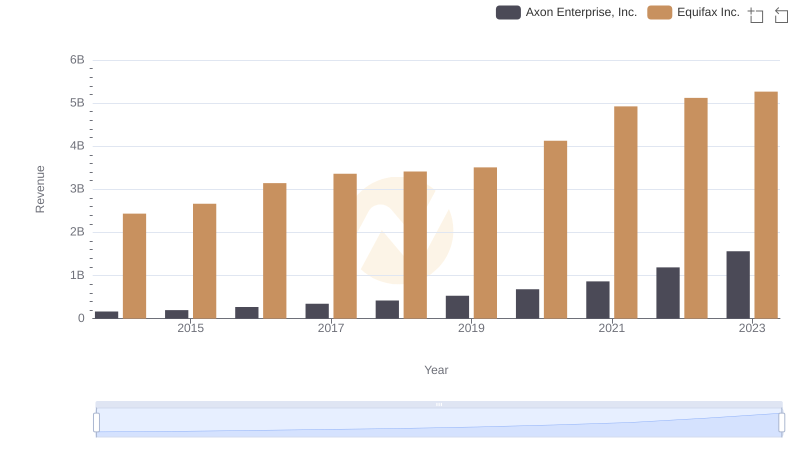
Annual Revenue Comparison: Axon Enterprise, Inc. vs Equifax Inc.
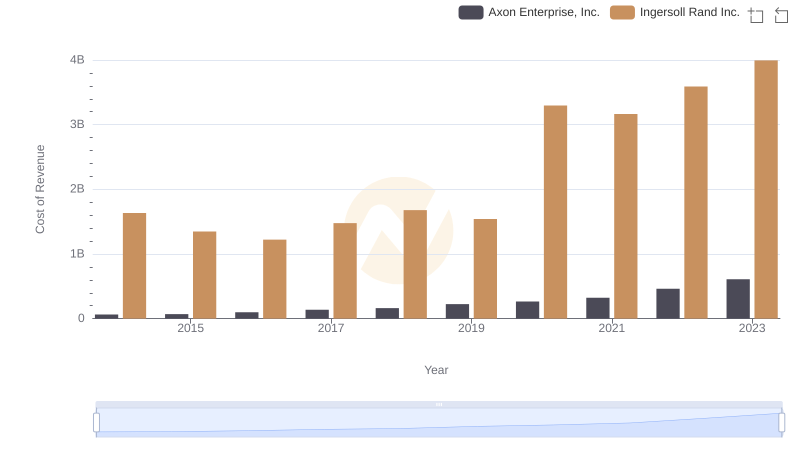
Analyzing Cost of Revenue: Axon Enterprise, Inc. and Ingersoll Rand Inc.
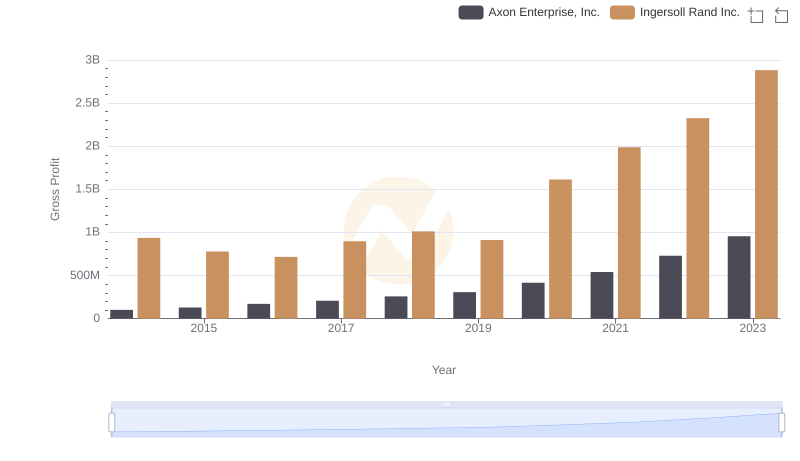
Axon Enterprise, Inc. and Ingersoll Rand Inc.: A Detailed Gross Profit Analysis
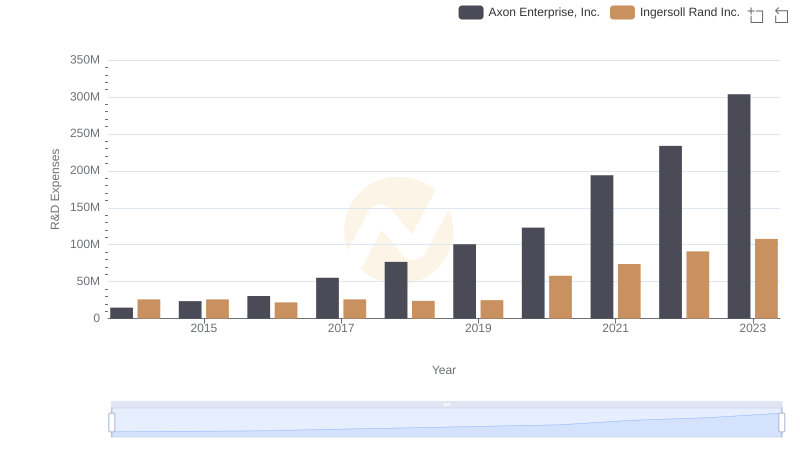
Research and Development Investment: Axon Enterprise, Inc. vs Ingersoll Rand Inc.