| __timestamp | Axon Enterprise, Inc. | Trane Technologies plc |
|---|---|---|
| Wednesday, January 1, 2014 | 62977000 | 8982800000 |
| Thursday, January 1, 2015 | 69245000 | 9301600000 |
| Friday, January 1, 2016 | 97709000 | 9329300000 |
| Sunday, January 1, 2017 | 136710000 | 9811600000 |
| Monday, January 1, 2018 | 161485000 | 10847600000 |
| Tuesday, January 1, 2019 | 223574000 | 11451500000 |
| Wednesday, January 1, 2020 | 264672000 | 8651300000 |
| Friday, January 1, 2021 | 322471000 | 9666800000 |
| Saturday, January 1, 2022 | 461297000 | 11026900000 |
| Sunday, January 1, 2023 | 608009000 | 11820400000 |
| Monday, January 1, 2024 | 12757700000 |
Unlocking the unknown
In the ever-evolving landscape of industrial and technology sectors, understanding cost structures is crucial. Trane Technologies plc, a leader in climate solutions, and Axon Enterprise, Inc., a pioneer in public safety technology, offer intriguing insights into their cost of revenue trends from 2014 to 2023.
Over the past decade, Trane Technologies has consistently maintained a high cost of revenue, averaging around $10 billion annually. Despite fluctuations, the company saw a notable increase of approximately 32% from 2014 to 2023, reflecting its robust market presence and operational scale.
Axon, on the other hand, has experienced a dramatic rise in its cost of revenue, surging by nearly 866% over the same period. This growth underscores Axon's aggressive expansion and innovation in the public safety sector.
These trends highlight the contrasting growth trajectories and strategic priorities of these two industry giants.
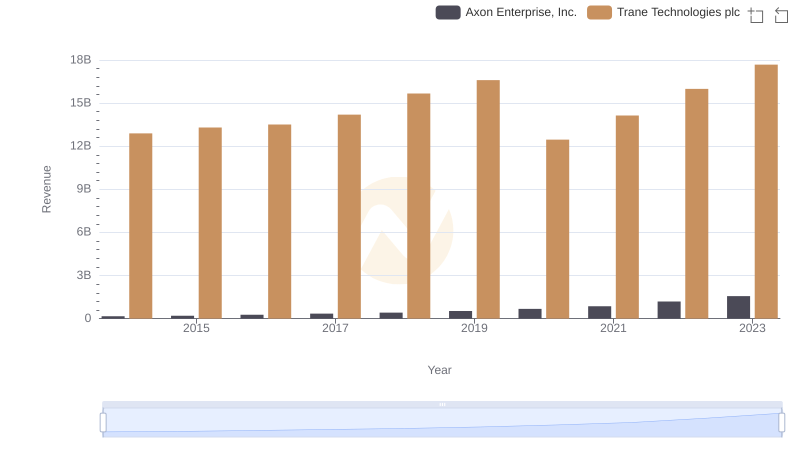
Revenue Showdown: Trane Technologies plc vs Axon Enterprise, Inc.
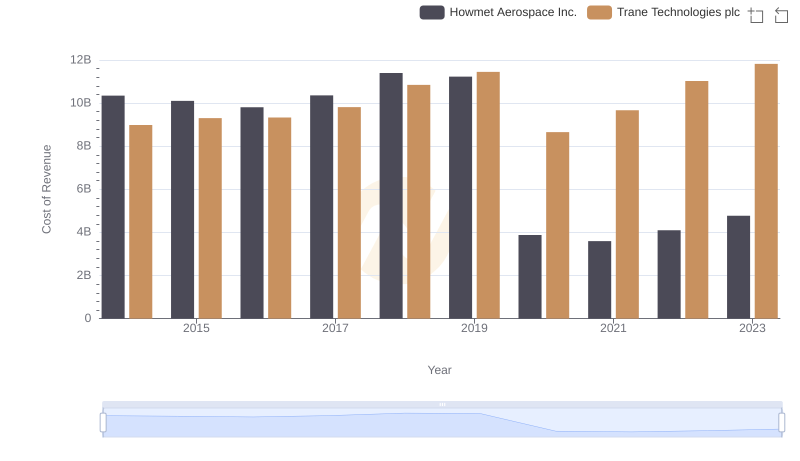
Cost of Revenue Trends: Trane Technologies plc vs Howmet Aerospace Inc.
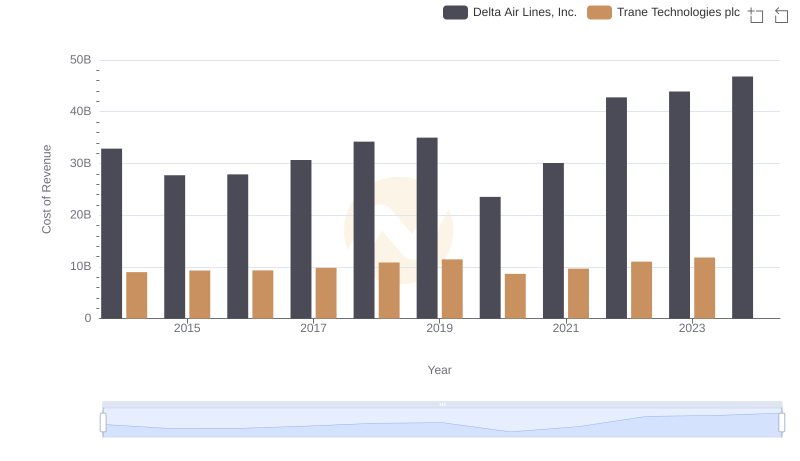
Analyzing Cost of Revenue: Trane Technologies plc and Delta Air Lines, Inc.
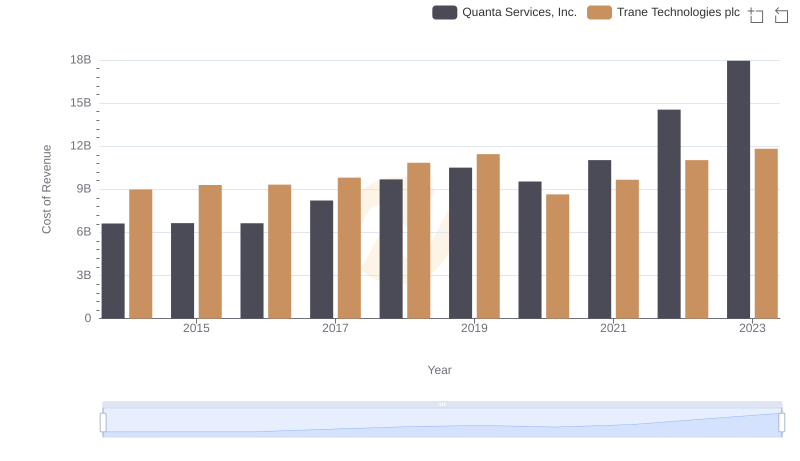
Comparing Cost of Revenue Efficiency: Trane Technologies plc vs Quanta Services, Inc.
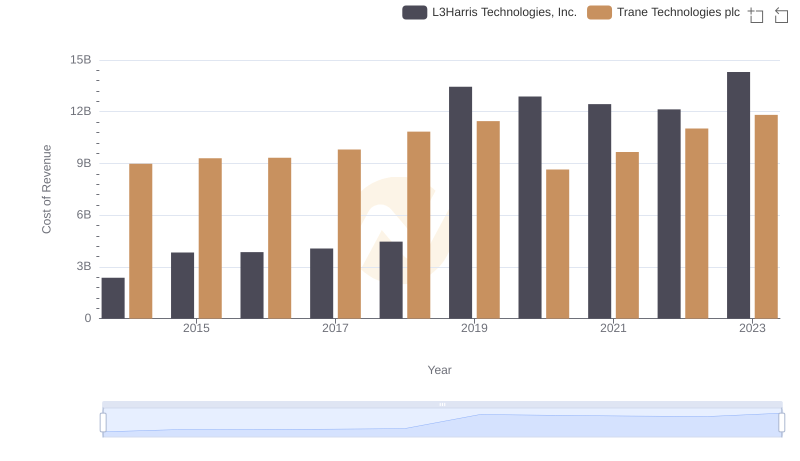
Trane Technologies plc vs L3Harris Technologies, Inc.: Efficiency in Cost of Revenue Explored
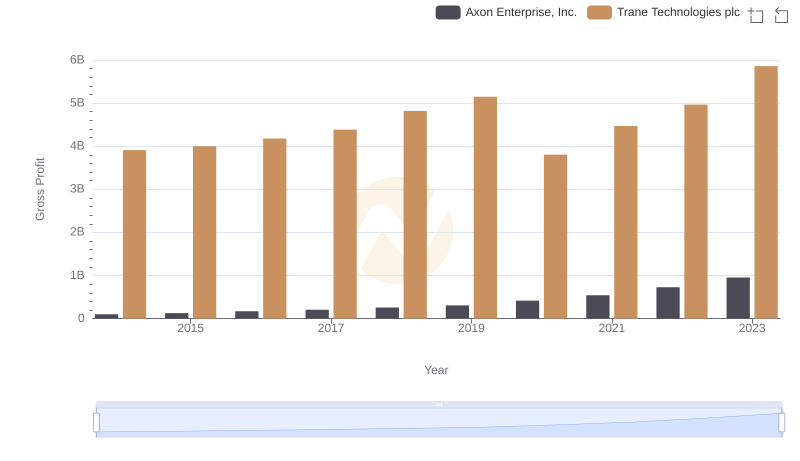
Trane Technologies plc vs Axon Enterprise, Inc.: A Gross Profit Performance Breakdown
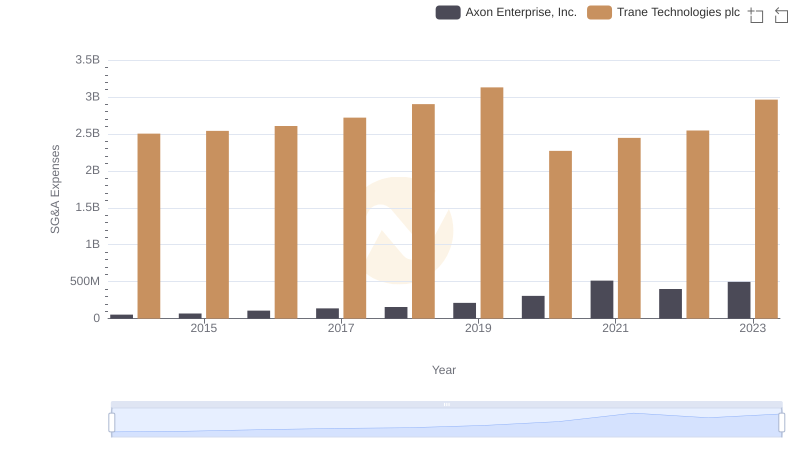
Operational Costs Compared: SG&A Analysis of Trane Technologies plc and Axon Enterprise, Inc.