| __timestamp | Quanta Services, Inc. | Trane Technologies plc |
|---|---|---|
| Wednesday, January 1, 2014 | 6617730000 | 8982800000 |
| Thursday, January 1, 2015 | 6648771000 | 9301600000 |
| Friday, January 1, 2016 | 6637519000 | 9329300000 |
| Sunday, January 1, 2017 | 8224618000 | 9811600000 |
| Monday, January 1, 2018 | 9691459000 | 10847600000 |
| Tuesday, January 1, 2019 | 10511901000 | 11451500000 |
| Wednesday, January 1, 2020 | 9541825000 | 8651300000 |
| Friday, January 1, 2021 | 11026954000 | 9666800000 |
| Saturday, January 1, 2022 | 14544748000 | 11026900000 |
| Sunday, January 1, 2023 | 17945120000 | 11820400000 |
| Monday, January 1, 2024 | 12757700000 |
Unlocking the unknown
In the ever-evolving landscape of industrial giants, Trane Technologies plc and Quanta Services, Inc. have showcased remarkable cost efficiency over the past decade. From 2014 to 2023, both companies have demonstrated a consistent upward trend in managing their cost of revenue, a critical metric for evaluating operational efficiency.
Quanta Services, Inc. has seen a staggering 171% increase in its cost of revenue, peaking in 2023. This growth reflects its expanding operations and strategic investments in infrastructure. Meanwhile, Trane Technologies plc has maintained a steady trajectory, with a 32% increase over the same period, highlighting its focus on sustainable and efficient practices.
This comparison not only underscores the dynamic nature of these industry leaders but also offers valuable insights into their strategic priorities. As we look to the future, understanding these trends will be crucial for investors and stakeholders alike.
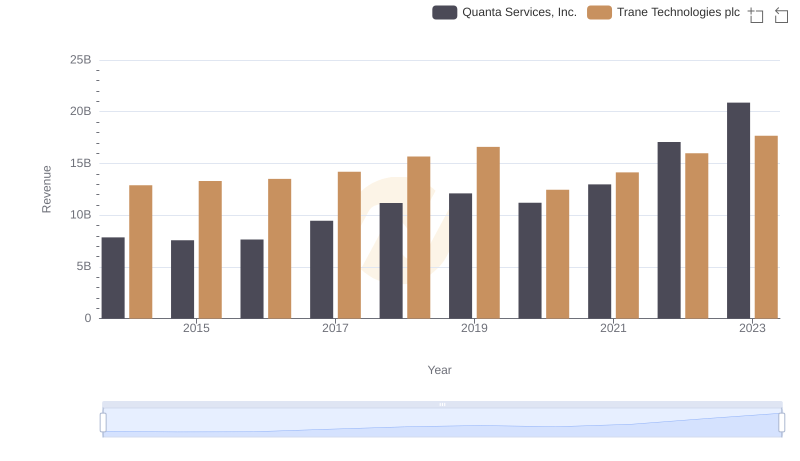
Annual Revenue Comparison: Trane Technologies plc vs Quanta Services, Inc.
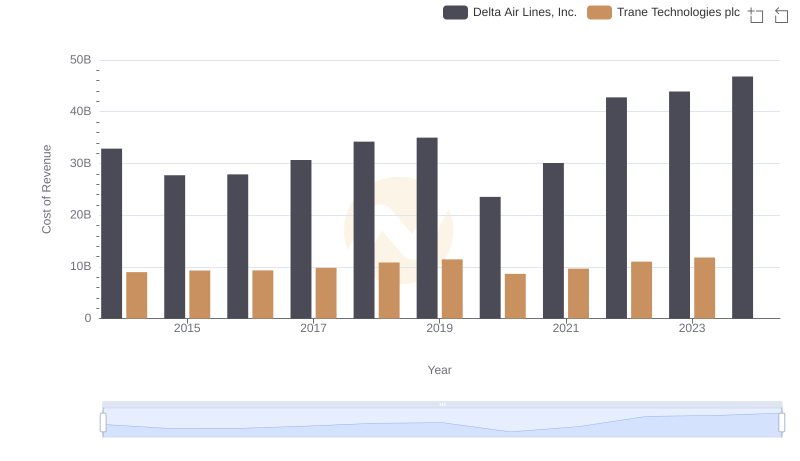
Analyzing Cost of Revenue: Trane Technologies plc and Delta Air Lines, Inc.
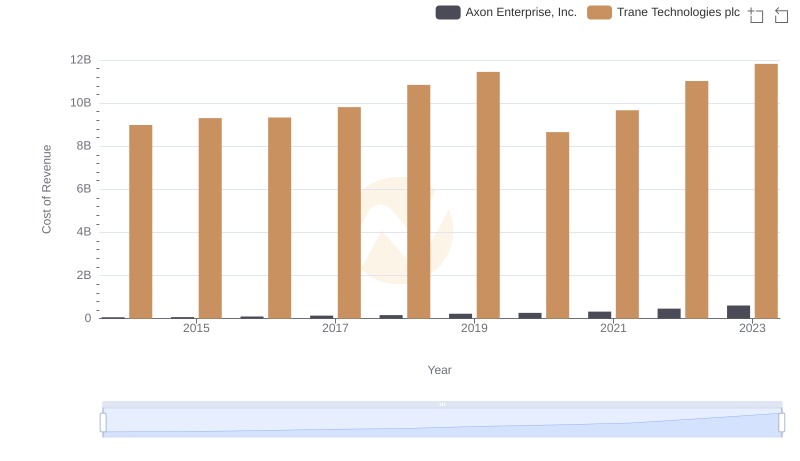
Cost of Revenue: Key Insights for Trane Technologies plc and Axon Enterprise, Inc.
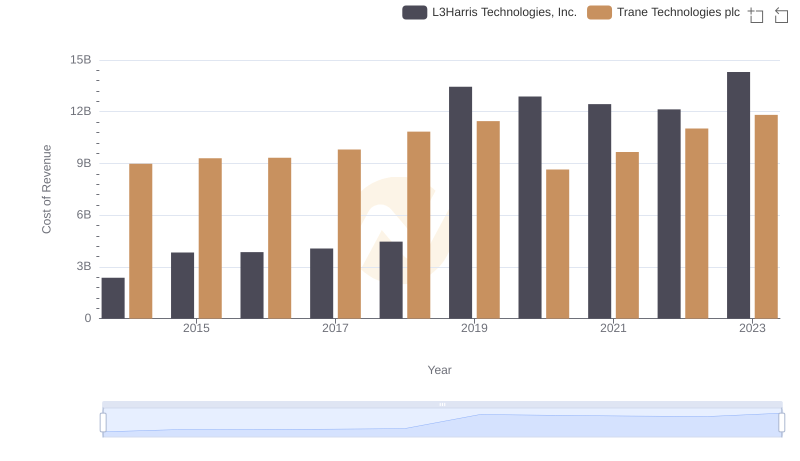
Trane Technologies plc vs L3Harris Technologies, Inc.: Efficiency in Cost of Revenue Explored