| __timestamp | The Boeing Company | Thomson Reuters Corporation |
|---|---|---|
| Wednesday, January 1, 2014 | 76752000000 | 9209000000 |
| Thursday, January 1, 2015 | 82088000000 | 8810000000 |
| Friday, January 1, 2016 | 80790000000 | 8232000000 |
| Sunday, January 1, 2017 | 76066000000 | 8079000000 |
| Monday, January 1, 2018 | 81490000000 | 4131000000 |
| Tuesday, January 1, 2019 | 72093000000 | 2431000000 |
| Wednesday, January 1, 2020 | 63843000000 | 2269000000 |
| Friday, January 1, 2021 | 59237000000 | 2478000000 |
| Saturday, January 1, 2022 | 63078000000 | 2408000000 |
| Sunday, January 1, 2023 | 70070000000 | 4095000000 |
| Monday, January 1, 2024 | 68508000000 |
Data in motion
In the ever-evolving landscape of global business, understanding the cost of revenue is crucial for evaluating a company's financial health. This analysis delves into the cost of revenue trends for The Boeing Company and Thomson Reuters Corporation from 2014 to 2023.
Boeing, a titan in aerospace, saw its cost of revenue peak in 2015, with a gradual decline of approximately 28% by 2021. This trend reflects the company's strategic adjustments amidst industry challenges, including the 737 MAX crisis and the COVID-19 pandemic.
Conversely, Thomson Reuters, a leader in information services, experienced a more stable cost of revenue. Despite a significant drop in 2018, the company maintained a consistent range, highlighting its resilience and adaptability in a competitive market.
Notably, data for Thomson Reuters in 2024 is unavailable, suggesting potential reporting delays or strategic shifts.
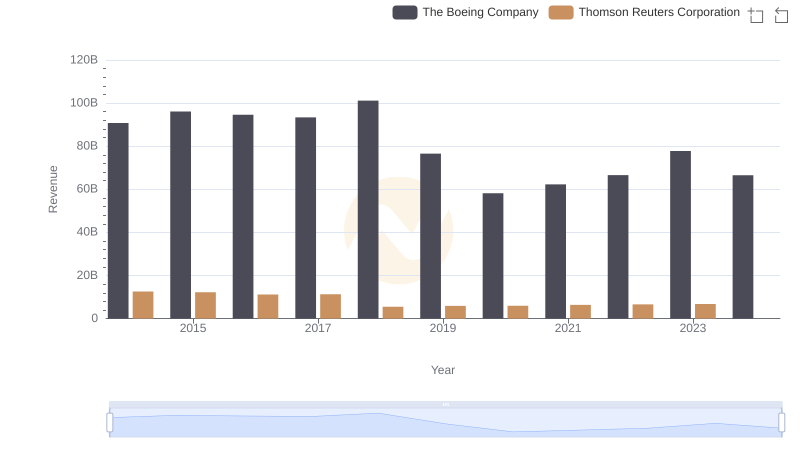
Annual Revenue Comparison: The Boeing Company vs Thomson Reuters Corporation

Cost of Revenue Comparison: The Boeing Company vs 3M Company
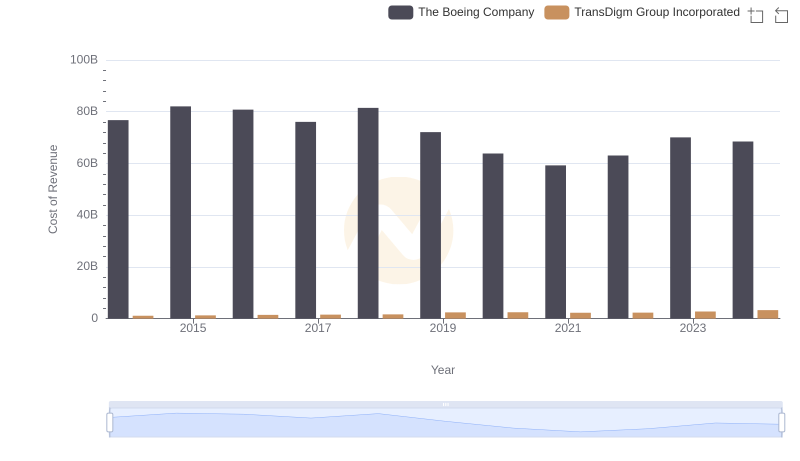
Cost of Revenue Trends: The Boeing Company vs TransDigm Group Incorporated
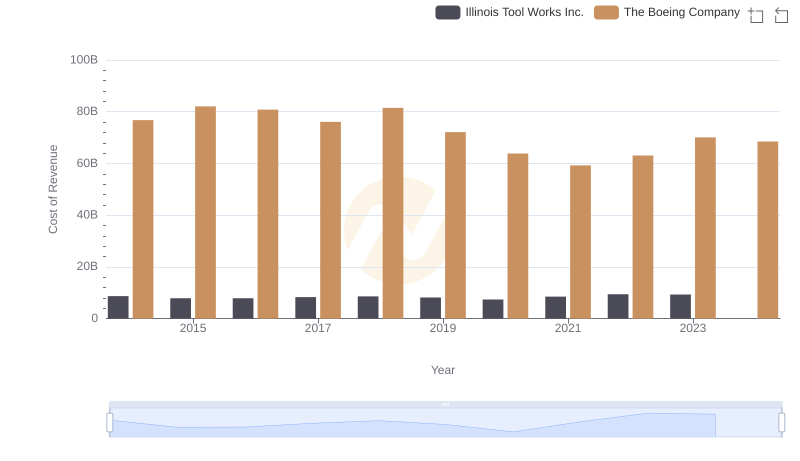
Cost Insights: Breaking Down The Boeing Company and Illinois Tool Works Inc.'s Expenses

Cost of Revenue Trends: The Boeing Company vs Emerson Electric Co.
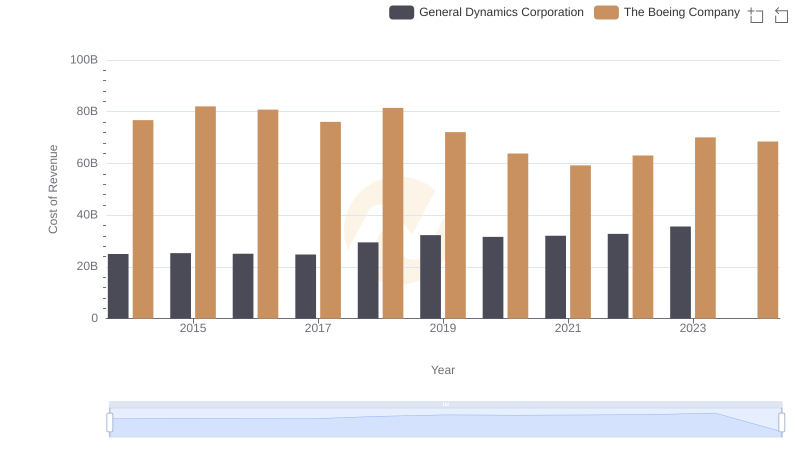
Cost of Revenue: Key Insights for The Boeing Company and General Dynamics Corporation
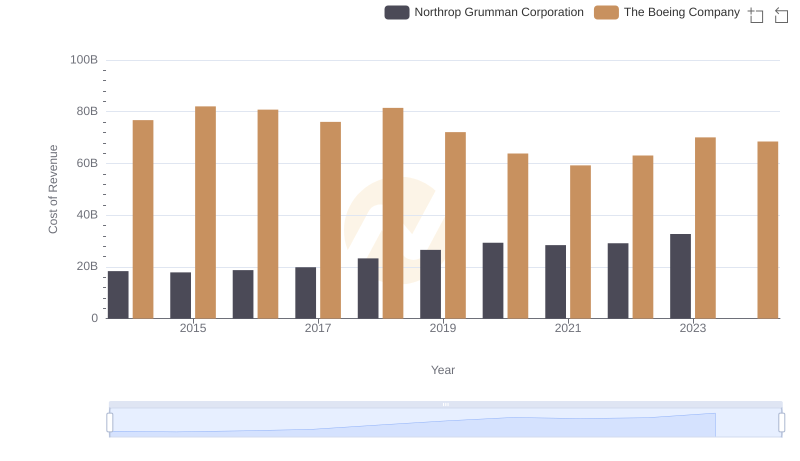
Analyzing Cost of Revenue: The Boeing Company and Northrop Grumman Corporation
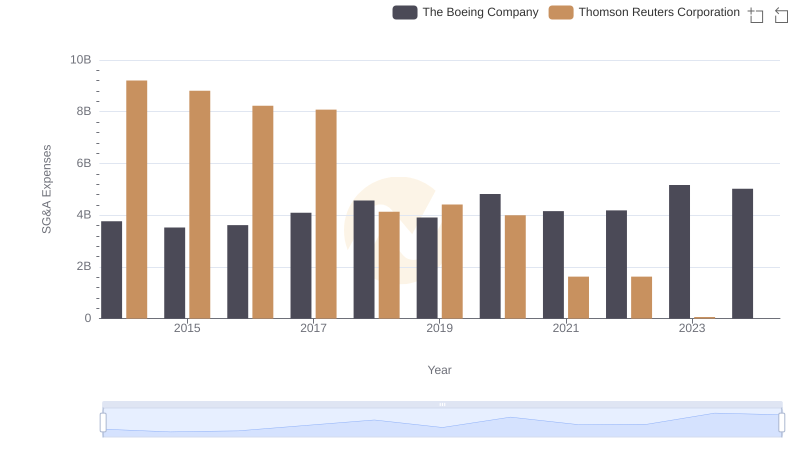
Selling, General, and Administrative Costs: The Boeing Company vs Thomson Reuters Corporation
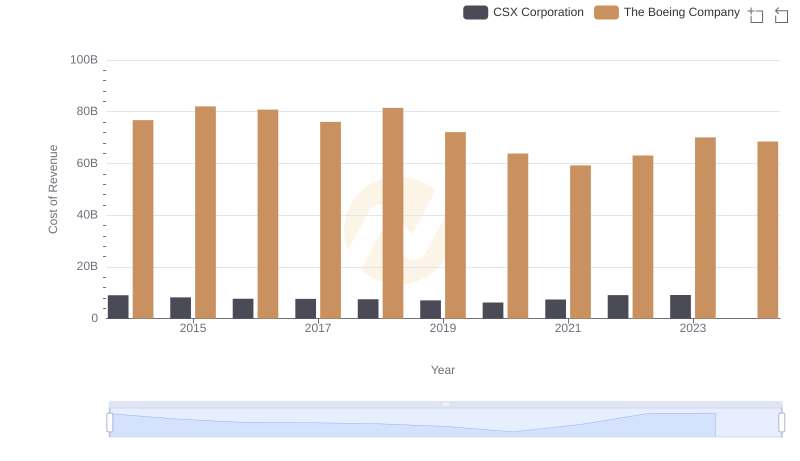
Analyzing Cost of Revenue: The Boeing Company and CSX Corporation

Cost of Revenue Comparison: The Boeing Company vs Republic Services, Inc.