| __timestamp | CSX Corporation | The Boeing Company |
|---|---|---|
| Wednesday, January 1, 2014 | 9056000000 | 76752000000 |
| Thursday, January 1, 2015 | 8227000000 | 82088000000 |
| Friday, January 1, 2016 | 7680000000 | 80790000000 |
| Sunday, January 1, 2017 | 7635000000 | 76066000000 |
| Monday, January 1, 2018 | 7477000000 | 81490000000 |
| Tuesday, January 1, 2019 | 7063000000 | 72093000000 |
| Wednesday, January 1, 2020 | 6221000000 | 63843000000 |
| Friday, January 1, 2021 | 7382000000 | 59237000000 |
| Saturday, January 1, 2022 | 9068000000 | 63078000000 |
| Sunday, January 1, 2023 | 9130000000 | 70070000000 |
| Monday, January 1, 2024 | 68508000000 |
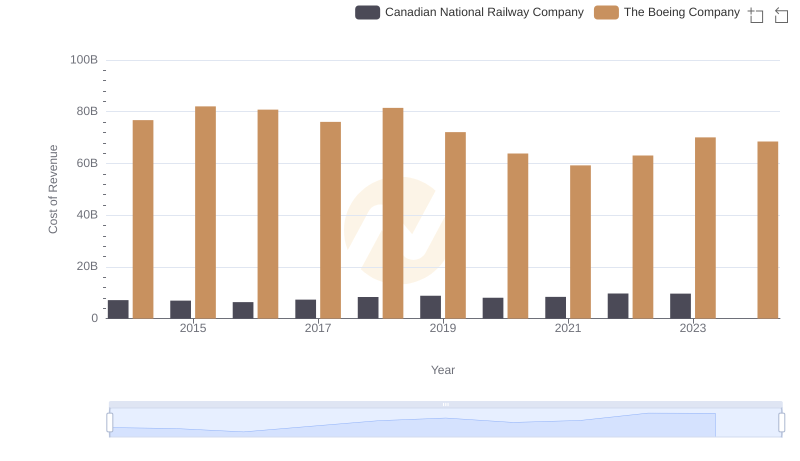
Unlocking the unknown
In the ever-evolving landscape of American industry, understanding the cost of revenue is crucial for evaluating a company's financial health. This analysis delves into the cost of revenue trends for The Boeing Company and CSX Corporation from 2014 to 2023.
Boeing, a titan in aerospace, saw its cost of revenue peak in 2015, with a notable 7% increase from the previous year. However, the subsequent years witnessed a decline, reaching a low in 2021. This trend reflects the challenges faced by the aviation industry, including the impact of global events on production and supply chains.
Conversely, CSX Corporation, a leader in rail transportation, maintained a more stable cost of revenue. Despite a dip in 2020, CSX rebounded by 2022, showcasing resilience and adaptability in the face of economic fluctuations.
The data highlights the contrasting financial journeys of these two industrial giants, offering insights into their strategic responses to market dynamics.
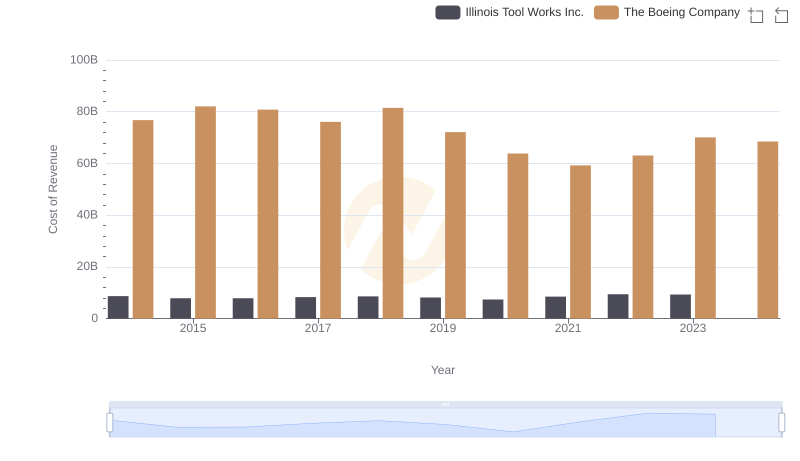
Cost Insights: Breaking Down The Boeing Company and Illinois Tool Works Inc.'s Expenses

Cost of Revenue Trends: The Boeing Company vs Emerson Electric Co.
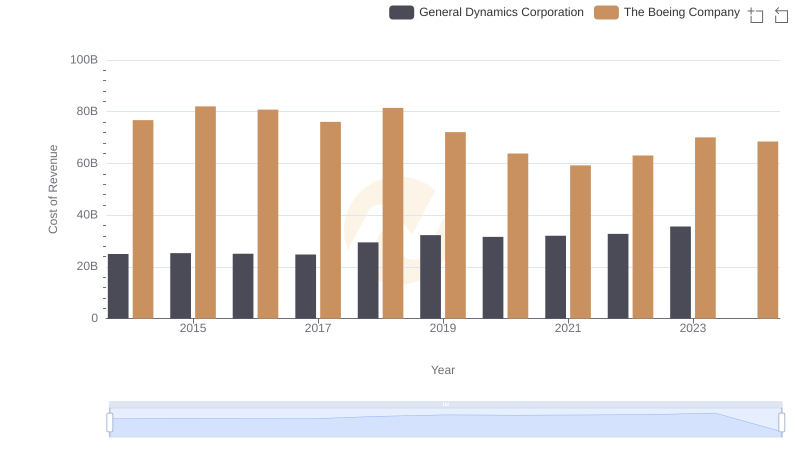
Cost of Revenue: Key Insights for The Boeing Company and General Dynamics Corporation
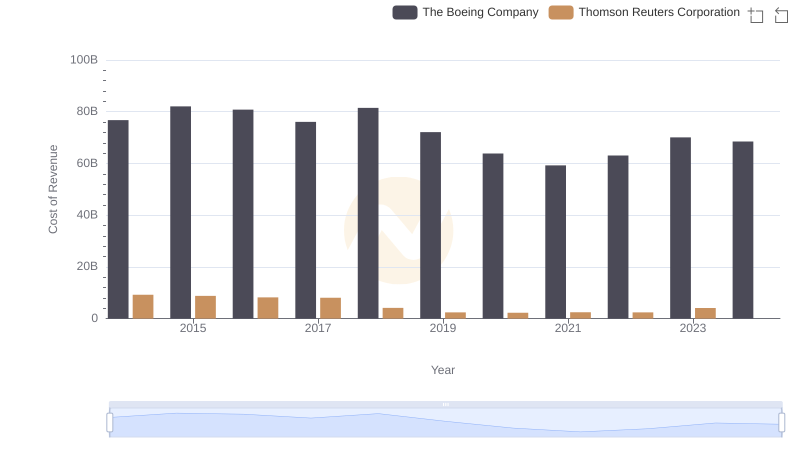
Analyzing Cost of Revenue: The Boeing Company and Thomson Reuters Corporation
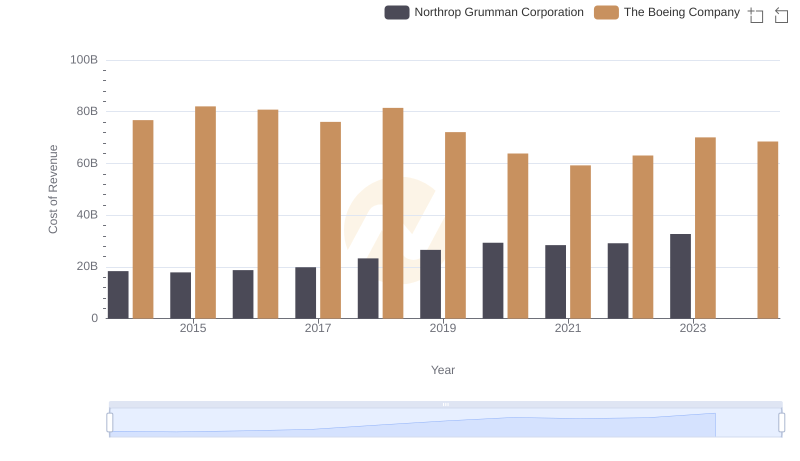
Analyzing Cost of Revenue: The Boeing Company and Northrop Grumman Corporation

Cost of Revenue Comparison: The Boeing Company vs Republic Services, Inc.
Analyzing Cost of Revenue: The Boeing Company and Canadian National Railway Company