| __timestamp | Emerson Electric Co. | The Boeing Company |
|---|---|---|
| Wednesday, January 1, 2014 | 14379000000 | 76752000000 |
| Thursday, January 1, 2015 | 13256000000 | 82088000000 |
| Friday, January 1, 2016 | 8260000000 | 80790000000 |
| Sunday, January 1, 2017 | 8860000000 | 76066000000 |
| Monday, January 1, 2018 | 9948000000 | 81490000000 |
| Tuesday, January 1, 2019 | 10557000000 | 72093000000 |
| Wednesday, January 1, 2020 | 9776000000 | 63843000000 |
| Friday, January 1, 2021 | 10673000000 | 59237000000 |
| Saturday, January 1, 2022 | 11441000000 | 63078000000 |
| Sunday, January 1, 2023 | 7738000000 | 70070000000 |
| Monday, January 1, 2024 | 9684000000 | 68508000000 |
Unleashing the power of data
In the ever-evolving landscape of aerospace and industrial manufacturing, understanding cost dynamics is crucial. Over the past decade, The Boeing Company and Emerson Electric Co. have showcased distinct trends in their cost of revenue. From 2014 to 2024, Boeing's cost of revenue has seen a notable decline of approximately 11%, reflecting strategic shifts and market challenges. In contrast, Emerson Electric's cost of revenue has remained relatively stable, with a slight decrease of around 7% over the same period.
These trends offer a window into the strategic maneuvers and market conditions shaping these industry giants.
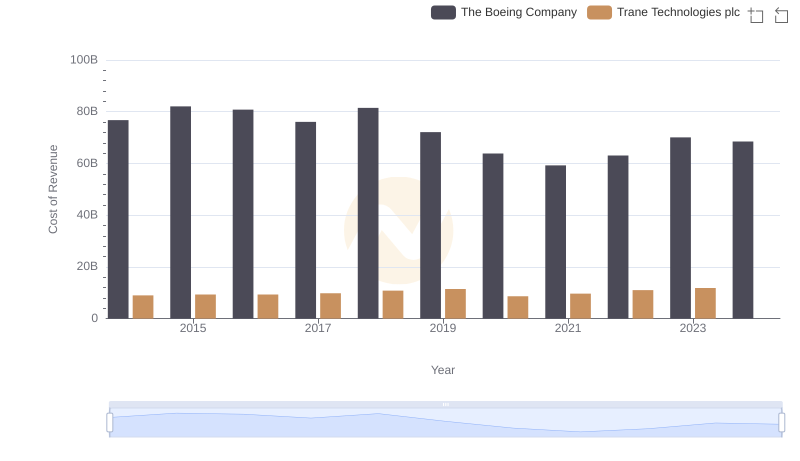
Comparing Cost of Revenue Efficiency: The Boeing Company vs Trane Technologies plc

Cost of Revenue Comparison: The Boeing Company vs 3M Company
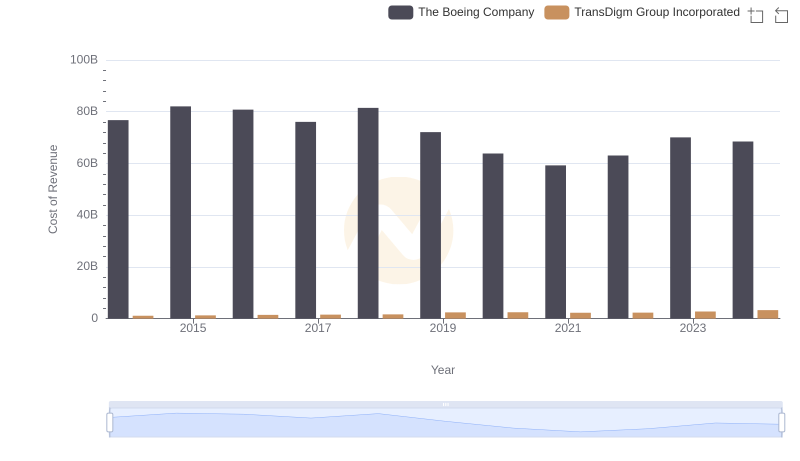
Cost of Revenue Trends: The Boeing Company vs TransDigm Group Incorporated
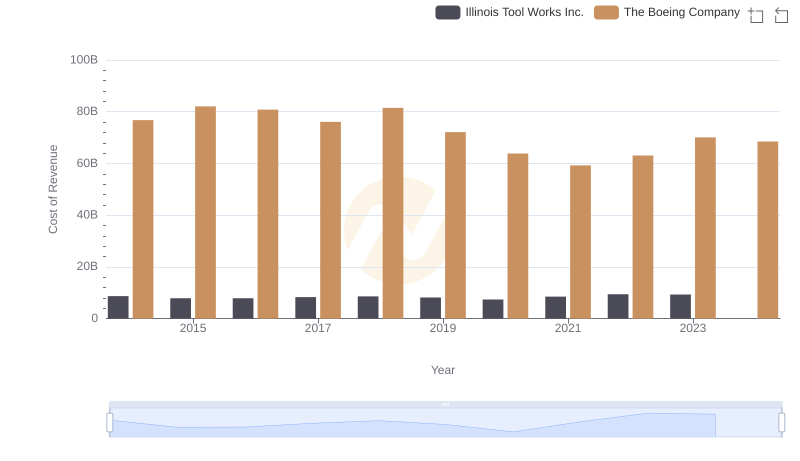
Cost Insights: Breaking Down The Boeing Company and Illinois Tool Works Inc.'s Expenses
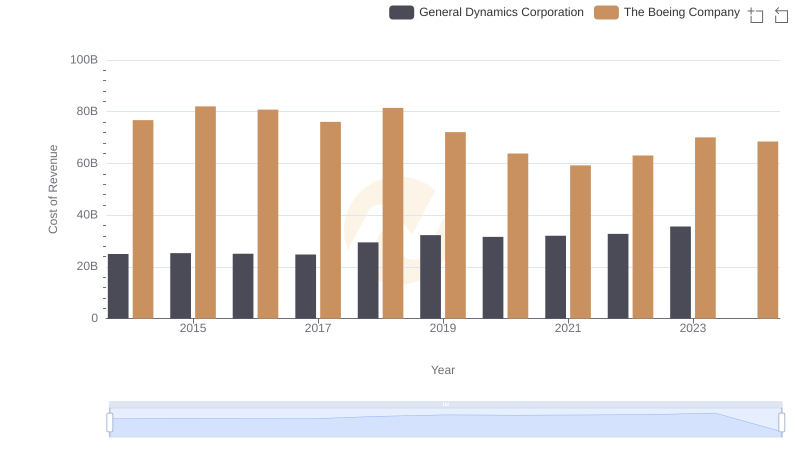
Cost of Revenue: Key Insights for The Boeing Company and General Dynamics Corporation
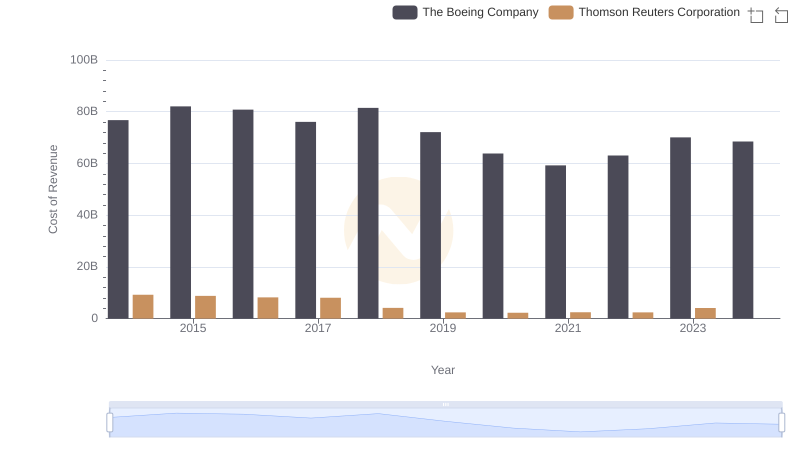
Analyzing Cost of Revenue: The Boeing Company and Thomson Reuters Corporation
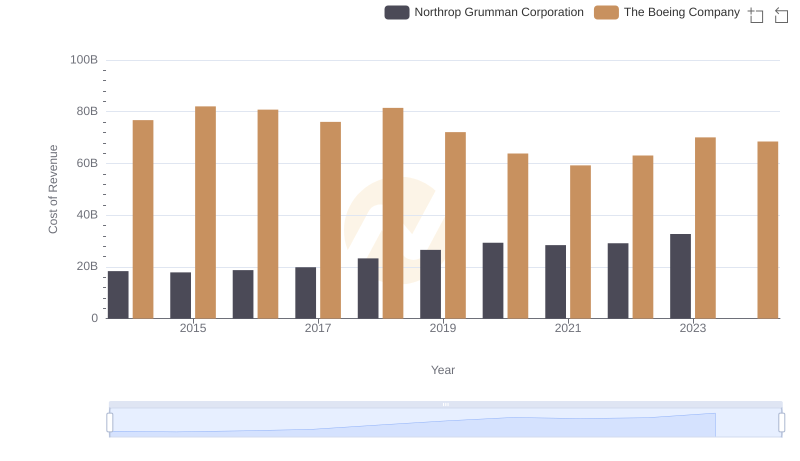
Analyzing Cost of Revenue: The Boeing Company and Northrop Grumman Corporation
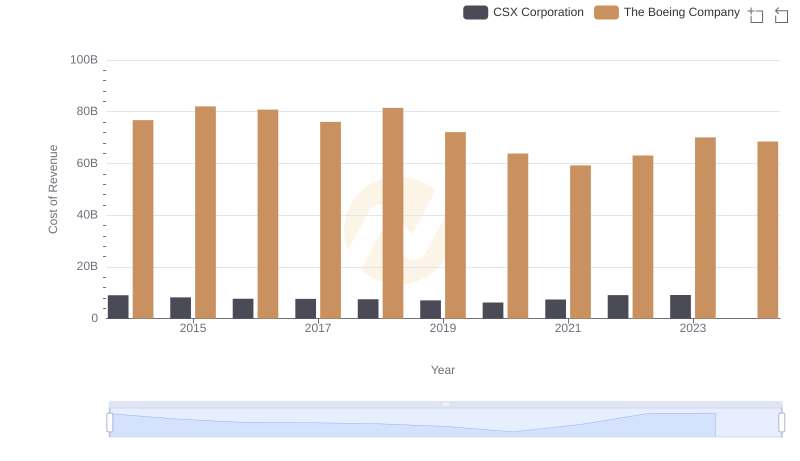
Analyzing Cost of Revenue: The Boeing Company and CSX Corporation