| __timestamp | 3M Company | The Boeing Company |
|---|---|---|
| Wednesday, January 1, 2014 | 16447000000 | 76752000000 |
| Thursday, January 1, 2015 | 15383000000 | 82088000000 |
| Friday, January 1, 2016 | 15040000000 | 80790000000 |
| Sunday, January 1, 2017 | 16001000000 | 76066000000 |
| Monday, January 1, 2018 | 16682000000 | 81490000000 |
| Tuesday, January 1, 2019 | 17136000000 | 72093000000 |
| Wednesday, January 1, 2020 | 16605000000 | 63843000000 |
| Friday, January 1, 2021 | 18795000000 | 59237000000 |
| Saturday, January 1, 2022 | 19232000000 | 63078000000 |
| Sunday, January 1, 2023 | 18477000000 | 70070000000 |
| Monday, January 1, 2024 | 14447000000 | 68508000000 |
Data in motion
In the ever-evolving landscape of American industry, The Boeing Company and 3M Company stand as titans in their respective fields. From 2014 to 2024, these two companies have showcased contrasting trends in their cost of revenue. Boeing, a leader in aerospace, saw its cost of revenue peak in 2015, only to decline by approximately 17% by 2023. This reflects the challenges faced by the aviation sector, including global disruptions and shifting market demands. Meanwhile, 3M, a diversified technology company, experienced a more stable trajectory, with a modest 13% increase in cost of revenue over the same period. This stability underscores 3M's resilience and adaptability in a competitive market. As we look to the future, these trends offer valuable insights into the strategic maneuvers of these industrial giants.
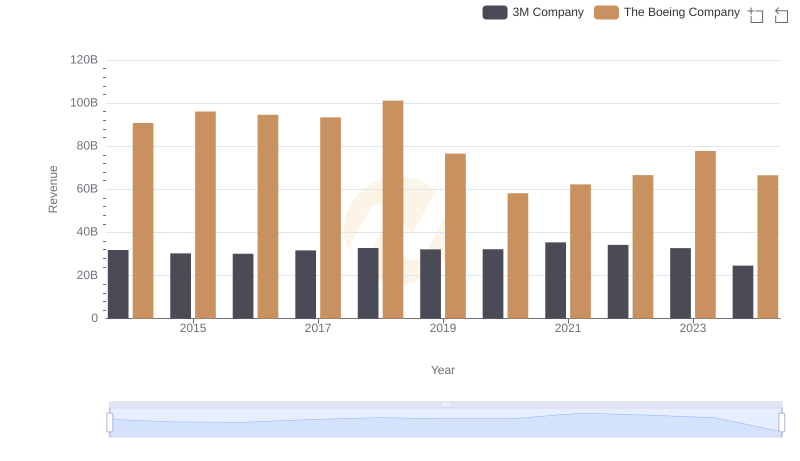
The Boeing Company or 3M Company: Who Leads in Yearly Revenue?
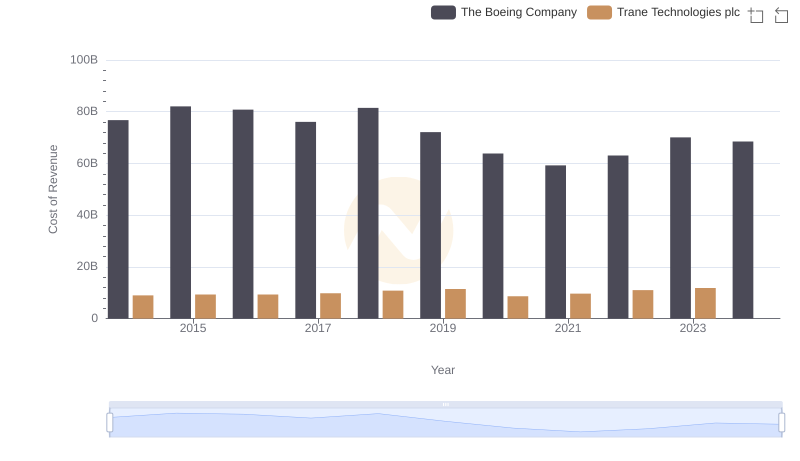
Comparing Cost of Revenue Efficiency: The Boeing Company vs Trane Technologies plc
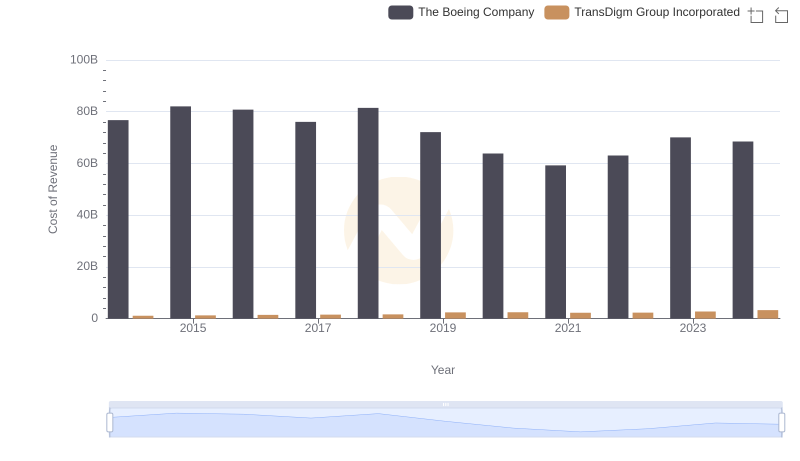
Cost of Revenue Trends: The Boeing Company vs TransDigm Group Incorporated
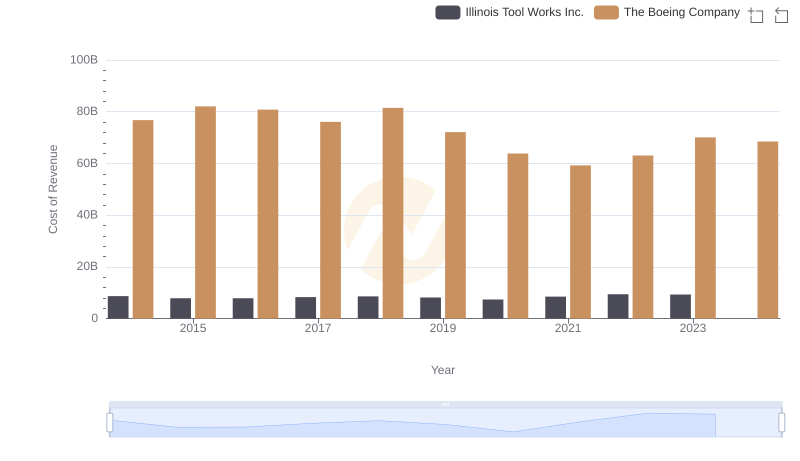
Cost Insights: Breaking Down The Boeing Company and Illinois Tool Works Inc.'s Expenses

Cost of Revenue Trends: The Boeing Company vs Emerson Electric Co.
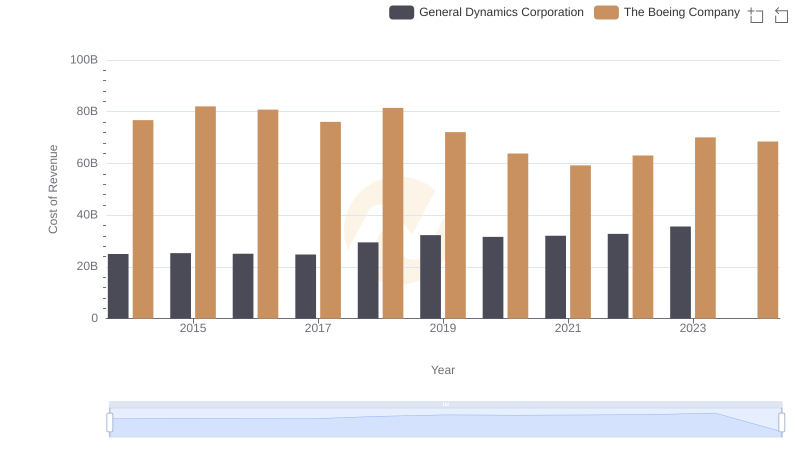
Cost of Revenue: Key Insights for The Boeing Company and General Dynamics Corporation
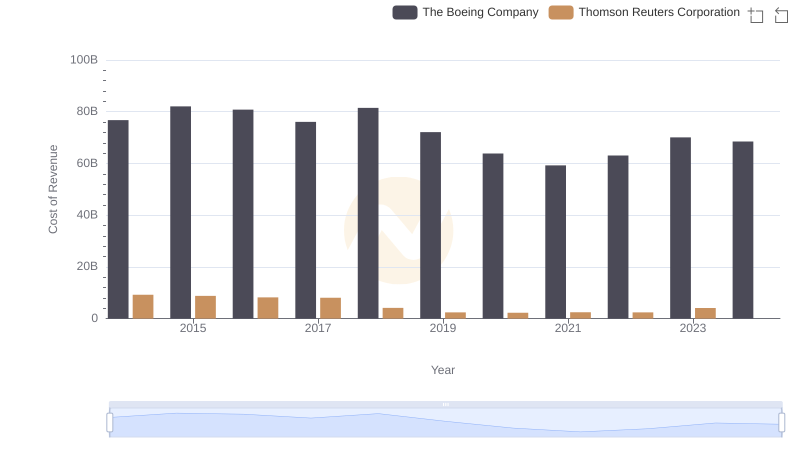
Analyzing Cost of Revenue: The Boeing Company and Thomson Reuters Corporation
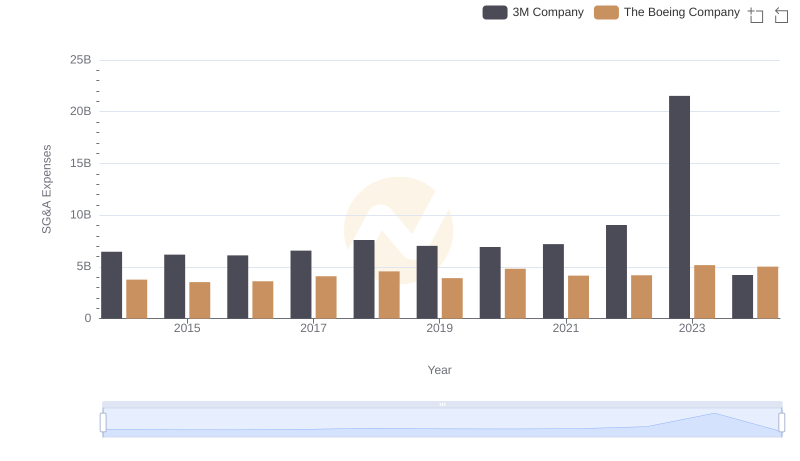
The Boeing Company or 3M Company: Who Manages SG&A Costs Better?