| __timestamp | Northrop Grumman Corporation | The Boeing Company |
|---|---|---|
| Wednesday, January 1, 2014 | 18378000000 | 76752000000 |
| Thursday, January 1, 2015 | 17884000000 | 82088000000 |
| Friday, January 1, 2016 | 18731000000 | 80790000000 |
| Sunday, January 1, 2017 | 19849000000 | 76066000000 |
| Monday, January 1, 2018 | 23304000000 | 81490000000 |
| Tuesday, January 1, 2019 | 26582000000 | 72093000000 |
| Wednesday, January 1, 2020 | 29321000000 | 63843000000 |
| Friday, January 1, 2021 | 28399000000 | 59237000000 |
| Saturday, January 1, 2022 | 29128000000 | 63078000000 |
| Sunday, January 1, 2023 | 32739000000 | 70070000000 |
| Monday, January 1, 2024 | 32671000000 | 68508000000 |
Cracking the code
In the competitive aerospace and defense industry, understanding cost dynamics is crucial. From 2014 to 2023, The Boeing Company and Northrop Grumman Corporation have shown distinct trends in their cost of revenue. Boeing's cost of revenue peaked in 2015, reaching approximately 82 billion, before experiencing a gradual decline, hitting a low in 2021. This represents a decrease of about 28% over the period. In contrast, Northrop Grumman's cost of revenue has steadily increased, growing by nearly 83% from 2014 to 2023, with a notable peak in 2023. This divergence highlights the different strategic approaches and market conditions faced by these giants. While Boeing faced challenges, Northrop Grumman capitalized on opportunities, reflecting broader industry shifts. Missing data for 2024 suggests ongoing changes, making future trends worth watching.
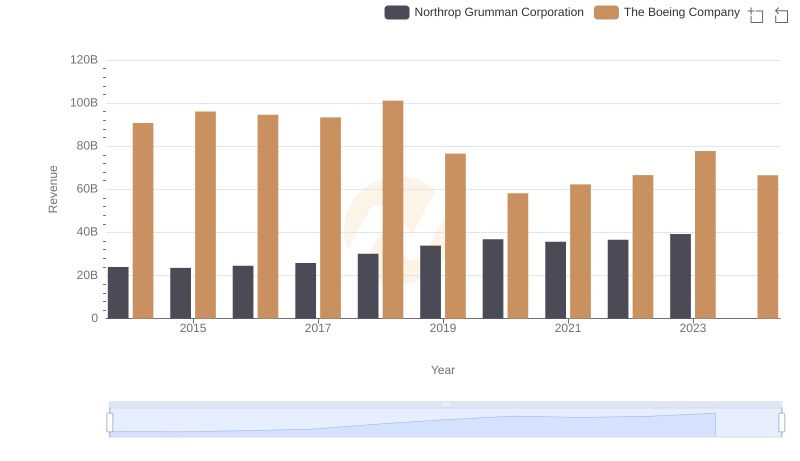
Who Generates More Revenue? The Boeing Company or Northrop Grumman Corporation

Cost of Revenue Trends: The Boeing Company vs Emerson Electric Co.
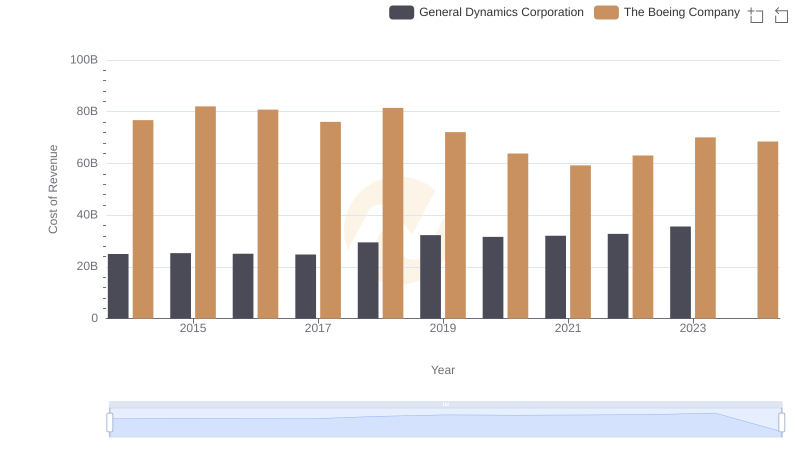
Cost of Revenue: Key Insights for The Boeing Company and General Dynamics Corporation
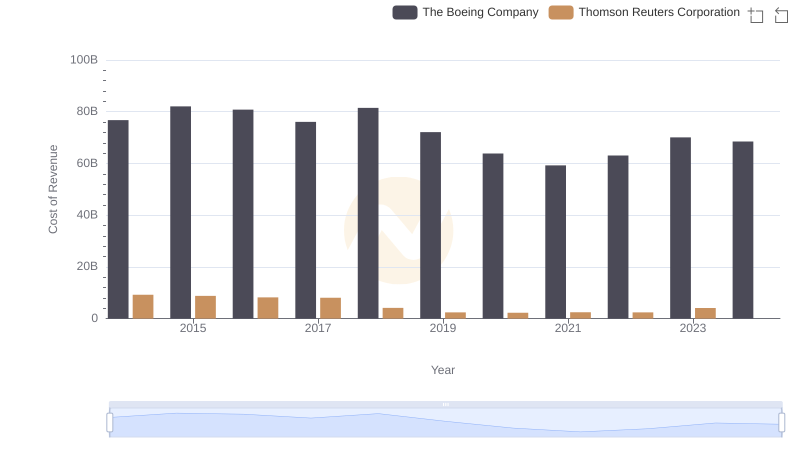
Analyzing Cost of Revenue: The Boeing Company and Thomson Reuters Corporation
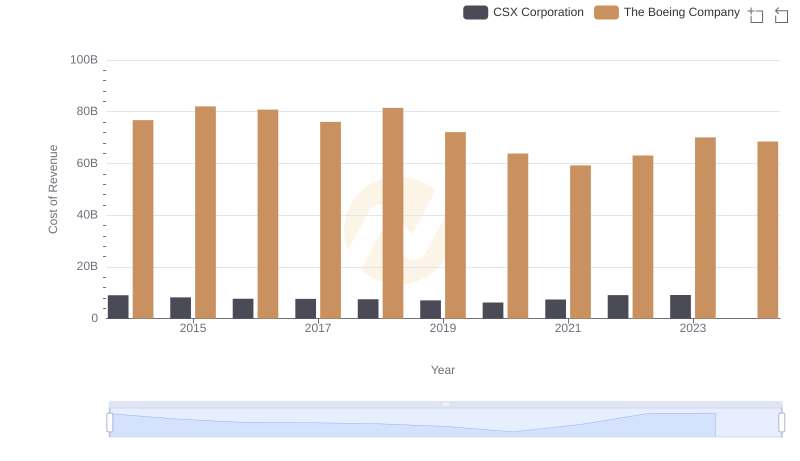
Analyzing Cost of Revenue: The Boeing Company and CSX Corporation
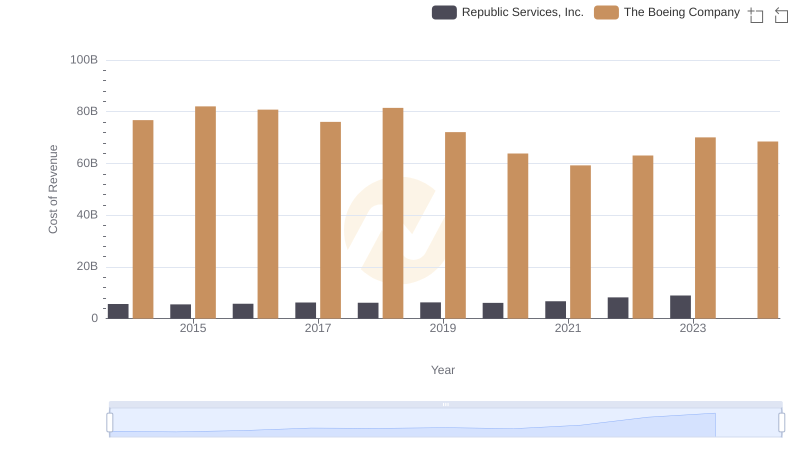
Cost of Revenue Comparison: The Boeing Company vs Republic Services, Inc.
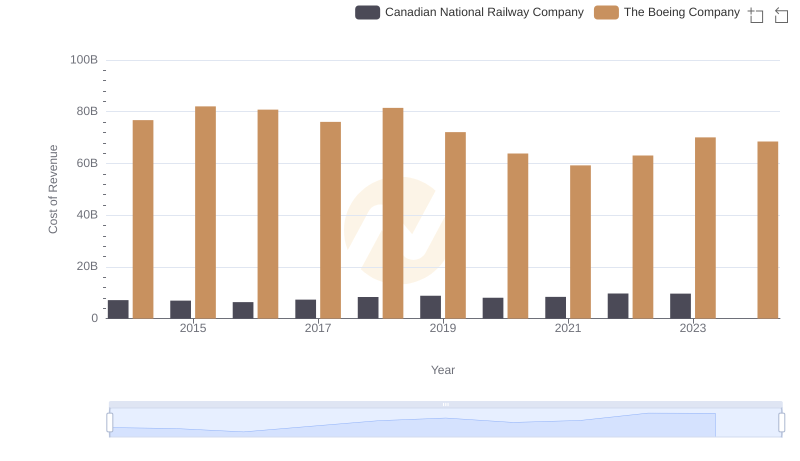
Analyzing Cost of Revenue: The Boeing Company and Canadian National Railway Company
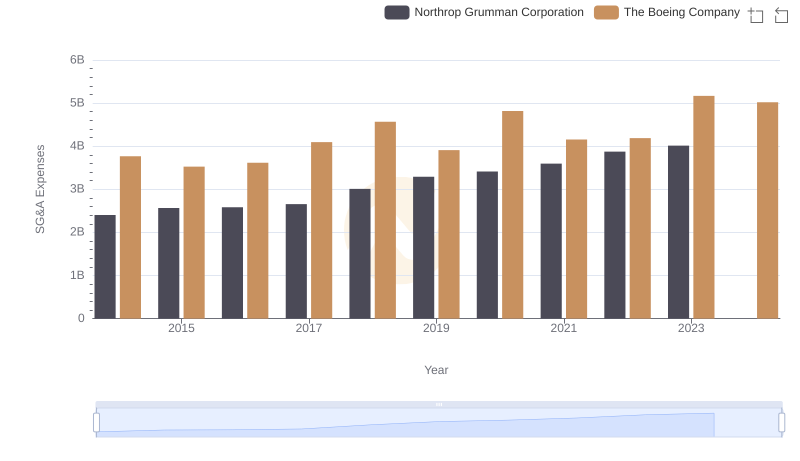
Operational Costs Compared: SG&A Analysis of The Boeing Company and Northrop Grumman Corporation