| __timestamp | Allegion plc | The Boeing Company |
|---|---|---|
| Wednesday, January 1, 2014 | 527400000 | 3767000000 |
| Thursday, January 1, 2015 | 510500000 | 3525000000 |
| Friday, January 1, 2016 | 559800000 | 3616000000 |
| Sunday, January 1, 2017 | 582500000 | 4094000000 |
| Monday, January 1, 2018 | 647500000 | 4567000000 |
| Tuesday, January 1, 2019 | 687200000 | 3909000000 |
| Wednesday, January 1, 2020 | 635700000 | 4817000000 |
| Friday, January 1, 2021 | 674700000 | 4157000000 |
| Saturday, January 1, 2022 | 736000000 | 4187000000 |
| Sunday, January 1, 2023 | 865600000 | 5168000000 |
| Monday, January 1, 2024 | 887800000 | 5021000000 |
Unveiling the hidden dimensions of data
In the world of corporate finance, understanding a company's spending patterns can reveal much about its strategic priorities. Over the past decade, The Boeing Company and Allegion plc have demonstrated distinct trends in their Selling, General, and Administrative (SG&A) expenses. From 2014 to 2023, Boeing's SG&A expenses have consistently been higher, peaking in 2023 with a 37% increase from 2015. Allegion, while smaller in scale, has shown a steady upward trajectory, with a notable 70% rise in the same period. This divergence highlights Boeing's expansive operational scale compared to Allegion's focused growth strategy. Interestingly, data for Allegion in 2024 is missing, suggesting potential shifts or reporting changes. As these companies navigate the complexities of their industries, their SG&A spending offers a window into their evolving business strategies.
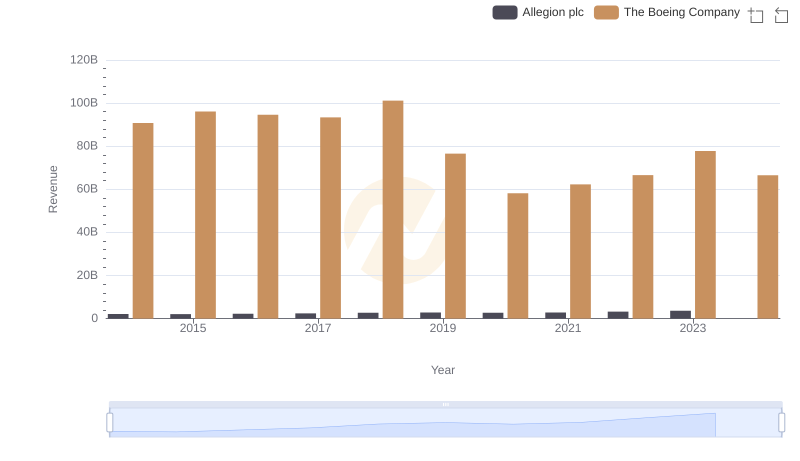
Revenue Showdown: The Boeing Company vs Allegion plc
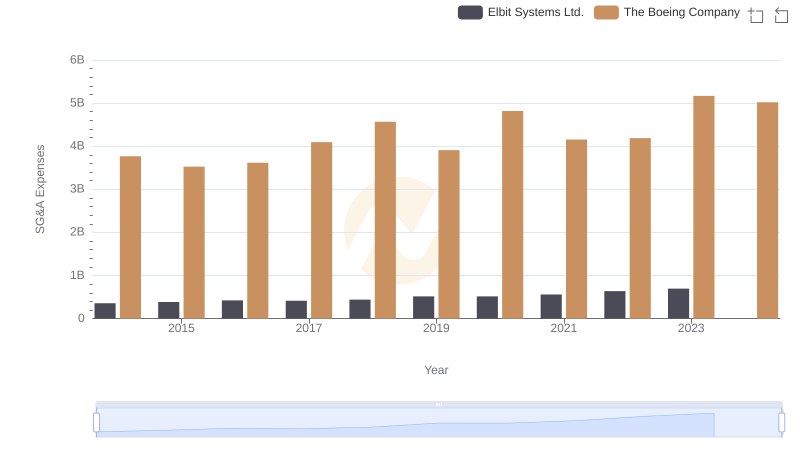
Operational Costs Compared: SG&A Analysis of The Boeing Company and Elbit Systems Ltd.
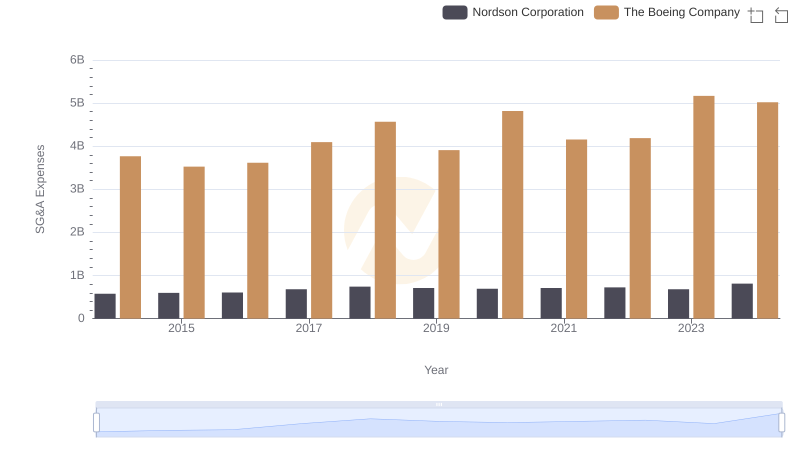
Operational Costs Compared: SG&A Analysis of The Boeing Company and Nordson Corporation
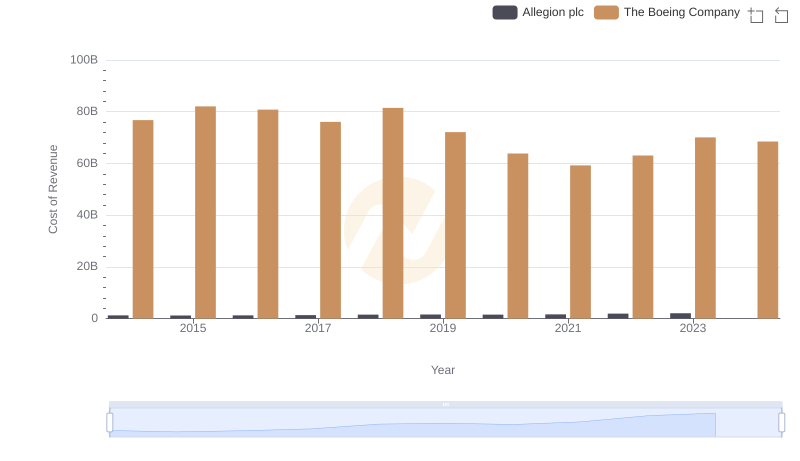
Analyzing Cost of Revenue: The Boeing Company and Allegion plc
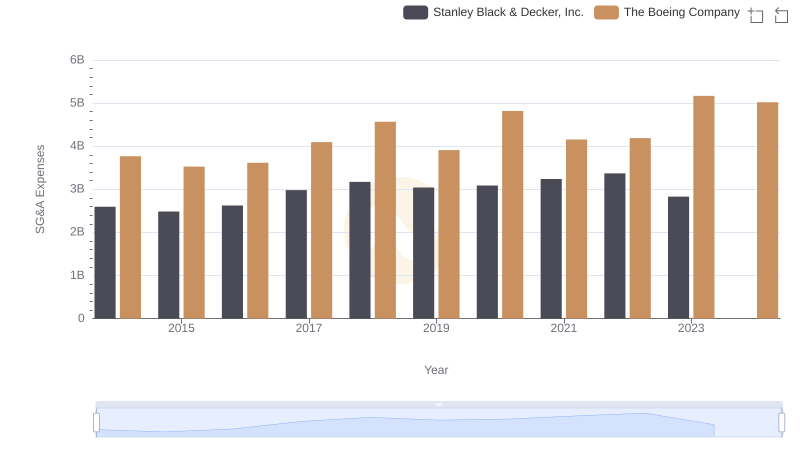
The Boeing Company or Stanley Black & Decker, Inc.: Who Manages SG&A Costs Better?

Who Optimizes SG&A Costs Better? The Boeing Company or Curtiss-Wright Corporation
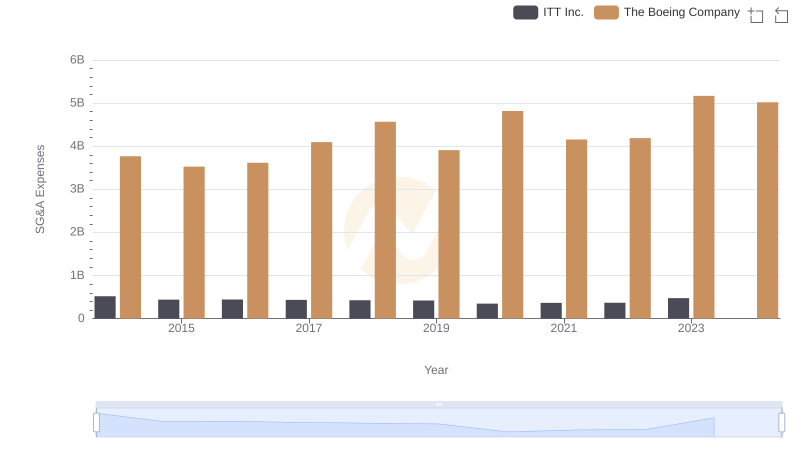
Who Optimizes SG&A Costs Better? The Boeing Company or ITT Inc.