| __timestamp | Global Payments Inc. | Rockwell Automation, Inc. |
|---|---|---|
| Wednesday, January 1, 2014 | 1022107000 | 3869600000 |
| Thursday, January 1, 2015 | 1147639000 | 3604800000 |
| Friday, January 1, 2016 | 1603532000 | 3404000000 |
| Sunday, January 1, 2017 | 1928037000 | 3687100000 |
| Monday, January 1, 2018 | 1095014000 | 3793800000 |
| Tuesday, January 1, 2019 | 2073803000 | 3794700000 |
| Wednesday, January 1, 2020 | 3650727000 | 3734600000 |
| Friday, January 1, 2021 | 3773725000 | 4099700000 |
| Saturday, January 1, 2022 | 3778617000 | 4658400000 |
| Sunday, January 1, 2023 | 3727521000 | 5341000000 |
| Monday, January 1, 2024 | 3760116000 | 5070800000 |
Unleashing insights
In the ever-evolving landscape of industrial automation and financial technology, understanding cost efficiency is paramount. Rockwell Automation, Inc. and Global Payments Inc. have been pivotal players in their respective fields. From 2014 to 2023, Rockwell Automation consistently demonstrated a higher cost of revenue, peaking at approximately $5.34 billion in 2023. This represents a 38% increase from 2014. In contrast, Global Payments saw a significant rise, with costs surging by 265% over the same period, reaching around $3.73 billion in 2023.
The data reveals a fascinating trend: while both companies have increased their cost of revenue, Rockwell Automation's growth has been more stable, whereas Global Payments experienced a more volatile trajectory. This analysis underscores the importance of strategic cost management in maintaining competitive advantage. Notably, data for 2024 is incomplete, suggesting ongoing developments in these industries.
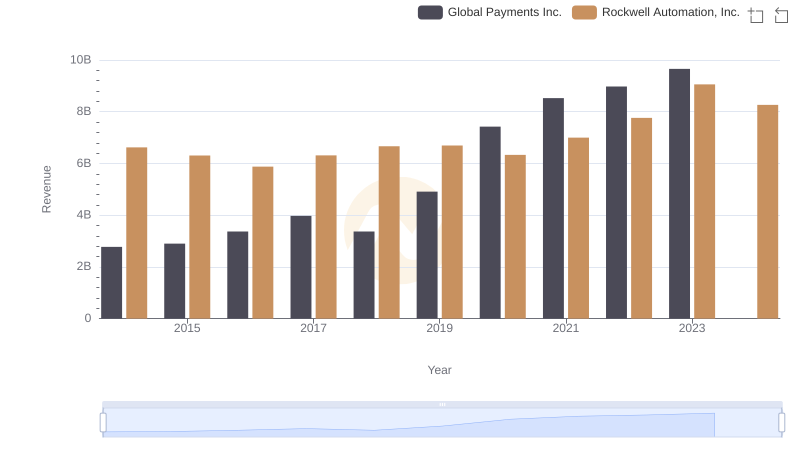
Comparing Revenue Performance: Rockwell Automation, Inc. or Global Payments Inc.?
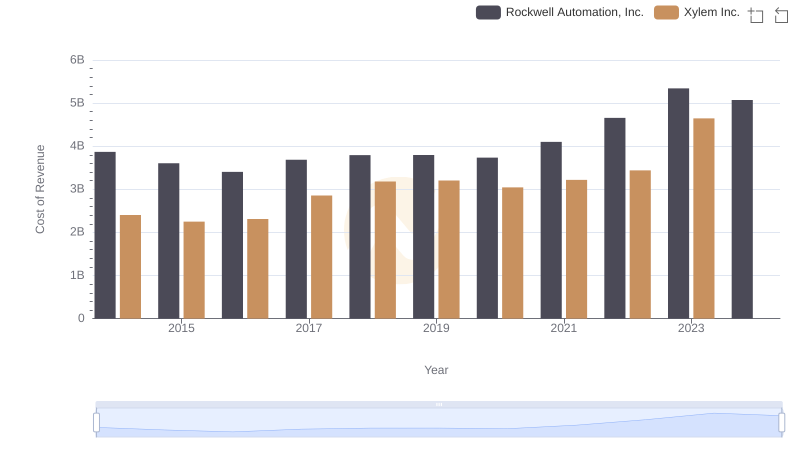
Analyzing Cost of Revenue: Rockwell Automation, Inc. and Xylem Inc.
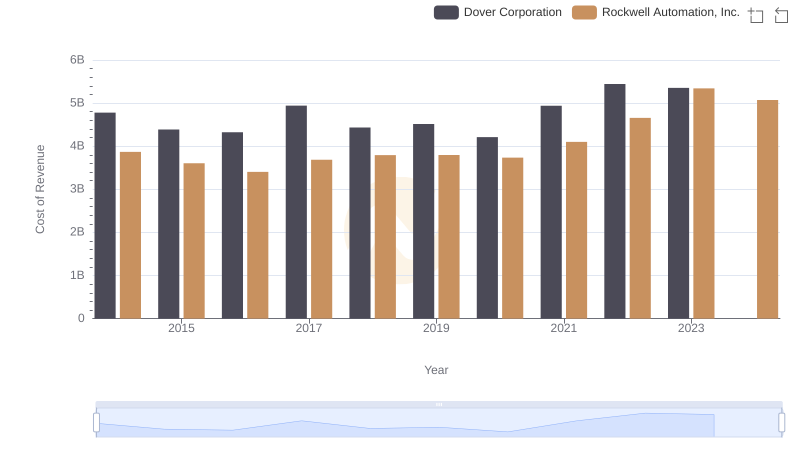
Analyzing Cost of Revenue: Rockwell Automation, Inc. and Dover Corporation
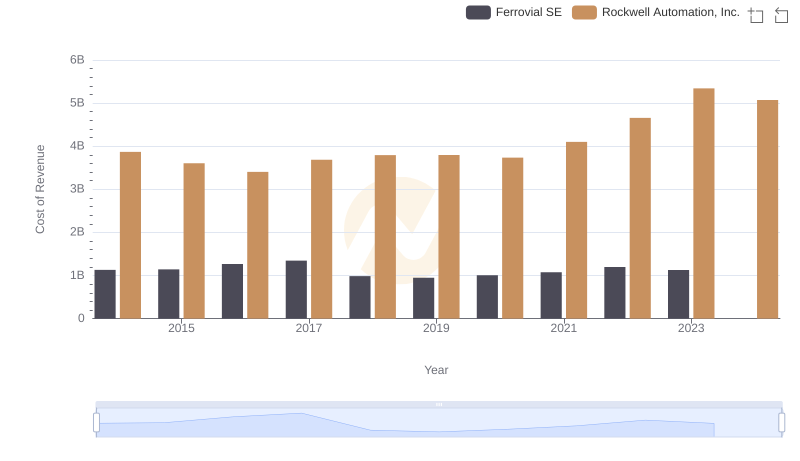
Comparing Cost of Revenue Efficiency: Rockwell Automation, Inc. vs Ferrovial SE
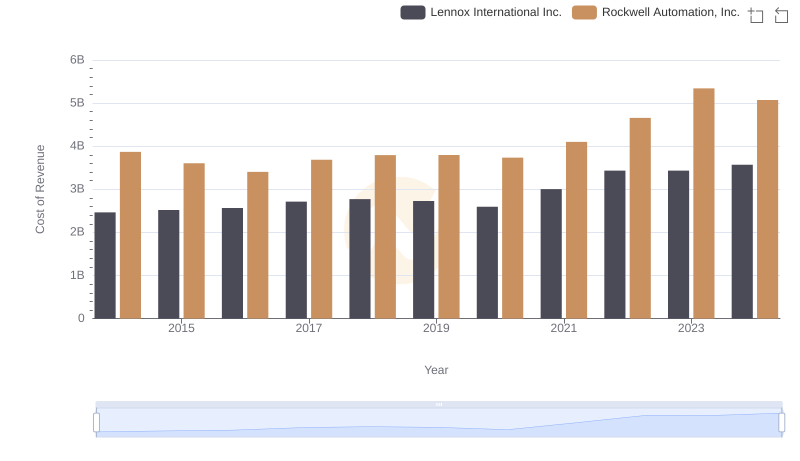
Cost of Revenue Trends: Rockwell Automation, Inc. vs Lennox International Inc.
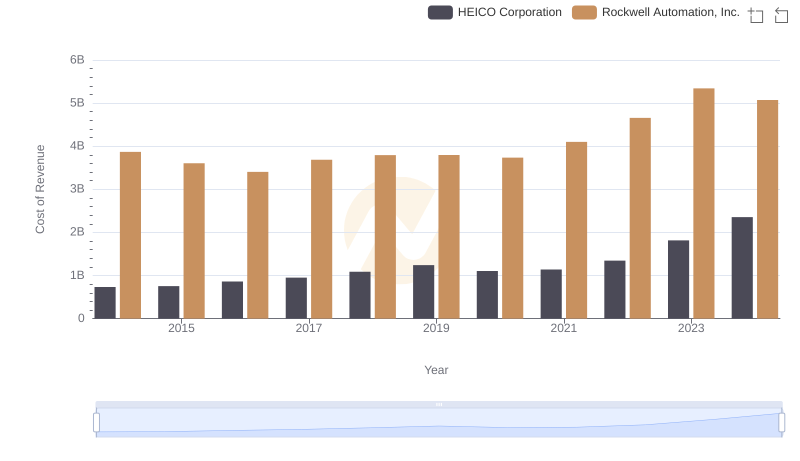
Analyzing Cost of Revenue: Rockwell Automation, Inc. and HEICO Corporation
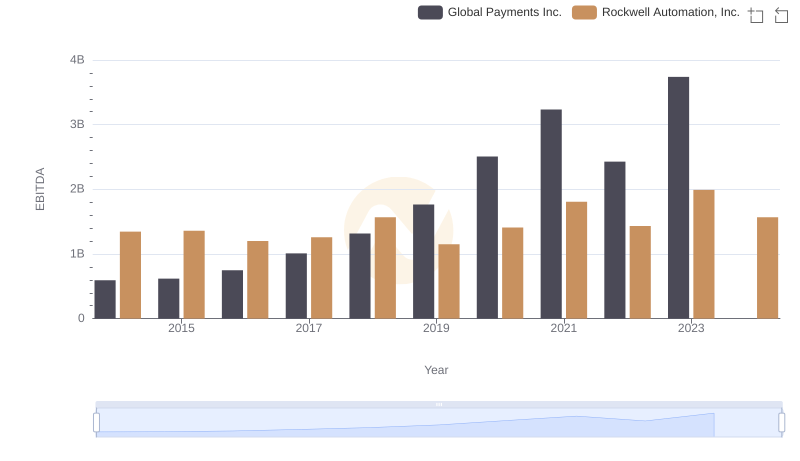
Rockwell Automation, Inc. vs Global Payments Inc.: In-Depth EBITDA Performance Comparison