| __timestamp | Norfolk Southern Corporation | Parker-Hannifin Corporation |
|---|---|---|
| Wednesday, January 1, 2014 | 11624000000 | 13215971000 |
| Thursday, January 1, 2015 | 10511000000 | 12711744000 |
| Friday, January 1, 2016 | 9888000000 | 11360753000 |
| Sunday, January 1, 2017 | 10551000000 | 12029312000 |
| Monday, January 1, 2018 | 11458000000 | 14302392000 |
| Tuesday, January 1, 2019 | 11296000000 | 14320324000 |
| Wednesday, January 1, 2020 | 9789000000 | 13695520000 |
| Friday, January 1, 2021 | 11142000000 | 14347640000 |
| Saturday, January 1, 2022 | 12745000000 | 15861608000 |
| Sunday, January 1, 2023 | 12156000000 | 19065194000 |
| Monday, January 1, 2024 | 12123000000 | 19929606000 |
Cracking the code
In the competitive landscape of American industry, Parker-Hannifin Corporation and Norfolk Southern Corporation stand as titans in their respective fields. Over the past decade, Parker-Hannifin has demonstrated a robust revenue growth trajectory, with a remarkable 44% increase from 2014 to 2023. This growth underscores its strategic prowess in the industrial sector. Meanwhile, Norfolk Southern, a key player in the transportation industry, has shown a more modest revenue increase of approximately 5% over the same period, reflecting the challenges and opportunities within the rail industry.
The data for 2024 is incomplete, offering a glimpse into the future potential of these industrial giants.

Breaking Down Revenue Trends: Parker-Hannifin Corporation vs FedEx Corporation
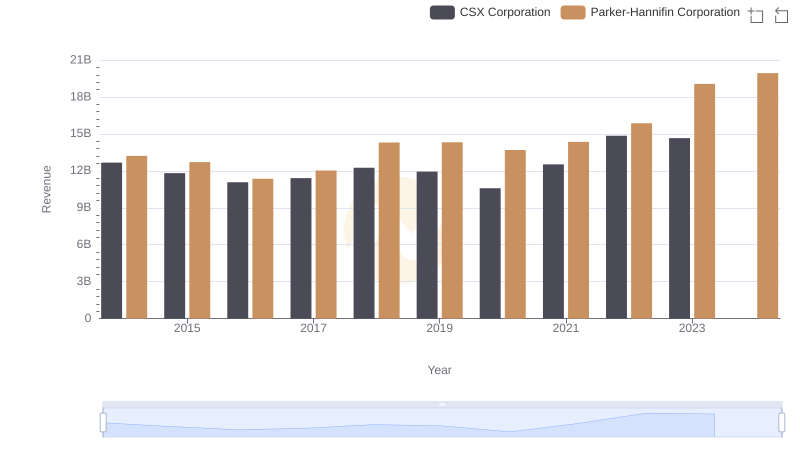
Comparing Revenue Performance: Parker-Hannifin Corporation or CSX Corporation?
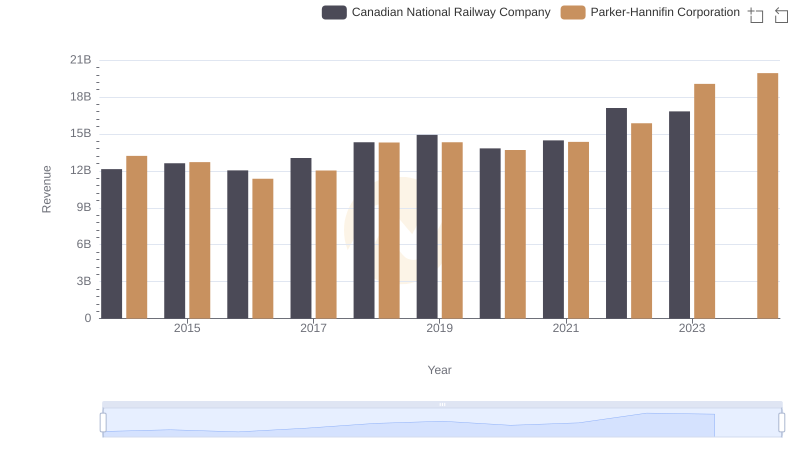
Who Generates More Revenue? Parker-Hannifin Corporation or Canadian National Railway Company

Breaking Down Revenue Trends: Parker-Hannifin Corporation vs Roper Technologies, Inc.
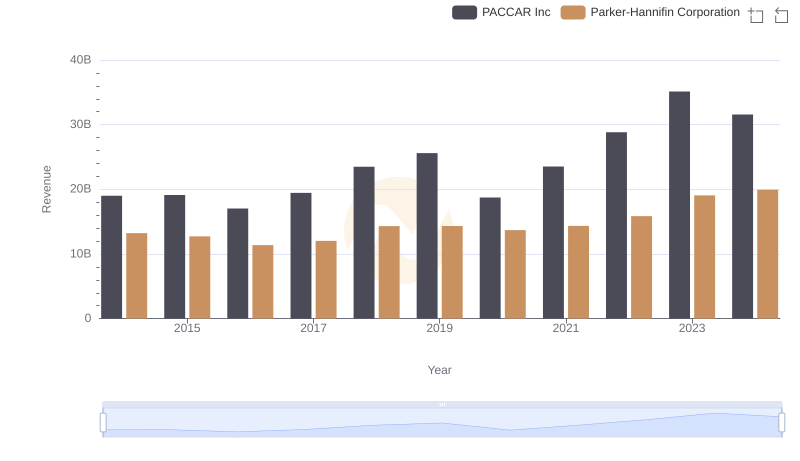
Comparing Revenue Performance: Parker-Hannifin Corporation or PACCAR Inc?
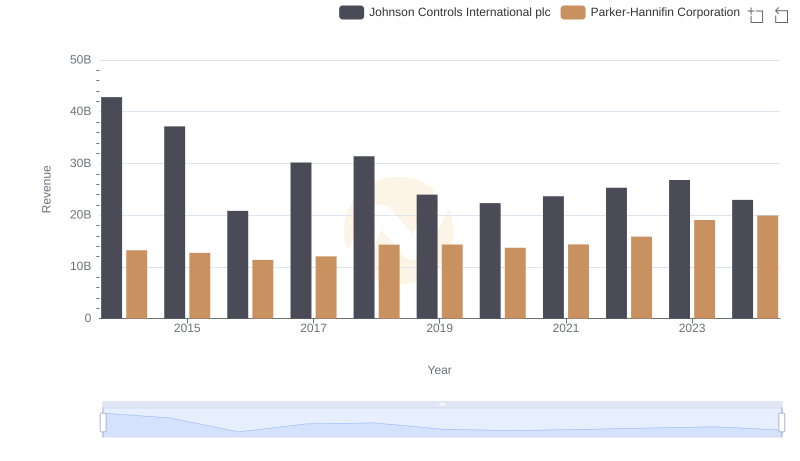
Who Generates More Revenue? Parker-Hannifin Corporation or Johnson Controls International plc
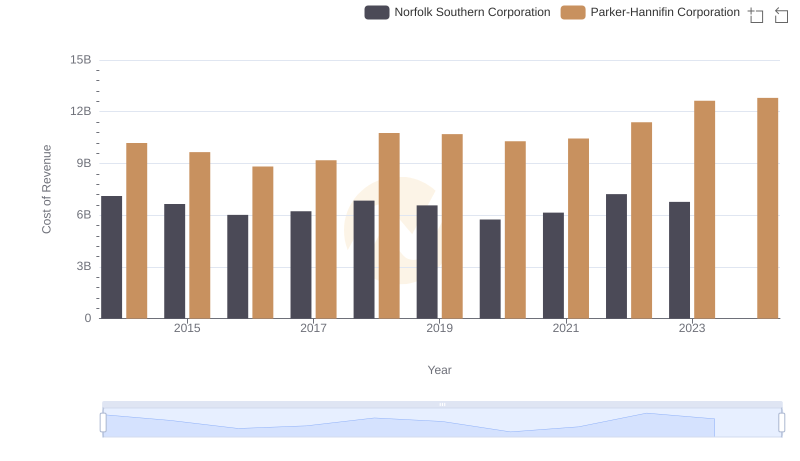
Analyzing Cost of Revenue: Parker-Hannifin Corporation and Norfolk Southern Corporation
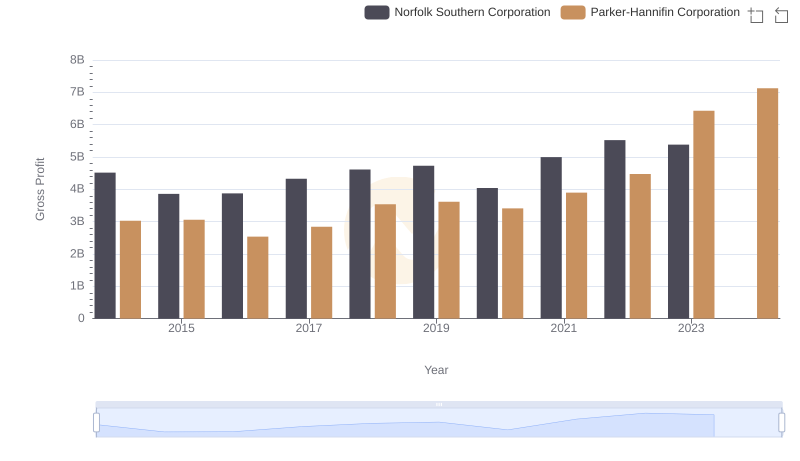
Who Generates Higher Gross Profit? Parker-Hannifin Corporation or Norfolk Southern Corporation

A Professional Review of EBITDA: Parker-Hannifin Corporation Compared to Norfolk Southern Corporation