| __timestamp | Parker-Hannifin Corporation | Roper Technologies, Inc. |
|---|---|---|
| Wednesday, January 1, 2014 | 10188227000 | 1447595000 |
| Thursday, January 1, 2015 | 9655245000 | 1417749000 |
| Friday, January 1, 2016 | 8823384000 | 1457515000 |
| Sunday, January 1, 2017 | 9188962000 | 1742675000 |
| Monday, January 1, 2018 | 10762841000 | 1911700000 |
| Tuesday, January 1, 2019 | 10703484000 | 1939700000 |
| Wednesday, January 1, 2020 | 10286518000 | 1984100000 |
| Friday, January 1, 2021 | 10449680000 | 1860400000 |
| Saturday, January 1, 2022 | 11387267000 | 1619000000 |
| Sunday, January 1, 2023 | 12635892000 | 1870600000 |
| Monday, January 1, 2024 | 12801816000 | 2160900000 |
In pursuit of knowledge
In the ever-evolving landscape of industrial technology, understanding cost structures is pivotal. Parker-Hannifin Corporation, a leader in motion and control technologies, and Roper Technologies, Inc., a diversified technology company, offer intriguing insights into cost management over the past decade. From 2014 to 2023, Parker-Hannifin's cost of revenue has shown a steady increase, peaking at approximately 28% higher in 2023 compared to 2014. In contrast, Roper Technologies experienced a more modest growth, with costs rising by about 29% over the same period. Notably, Parker-Hannifin's costs surged significantly in 2023, while Roper's data for 2024 remains elusive, hinting at potential strategic shifts. This analysis underscores the importance of cost efficiency in maintaining competitive advantage in the industrial sector. As we look to the future, these trends may offer valuable lessons for businesses navigating the complexities of global markets.
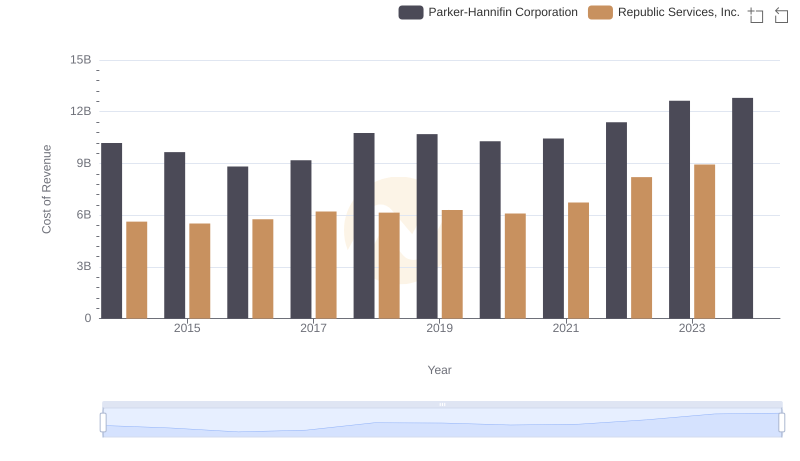
Cost of Revenue Comparison: Parker-Hannifin Corporation vs Republic Services, Inc.

Breaking Down Revenue Trends: Parker-Hannifin Corporation vs Roper Technologies, Inc.
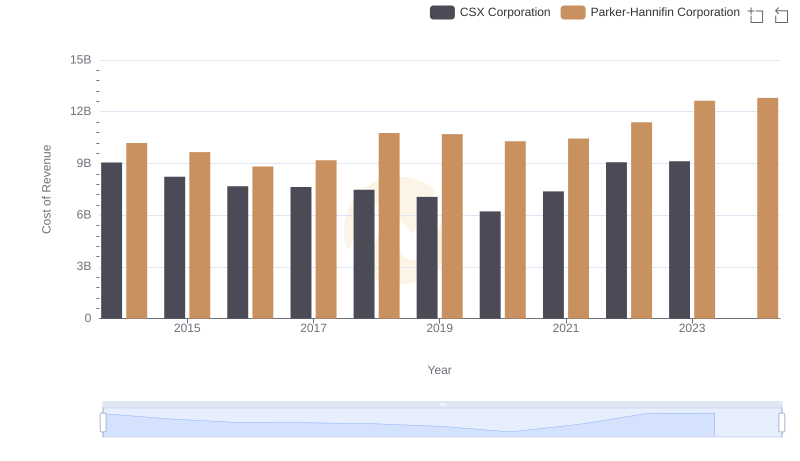
Cost of Revenue Trends: Parker-Hannifin Corporation vs CSX Corporation
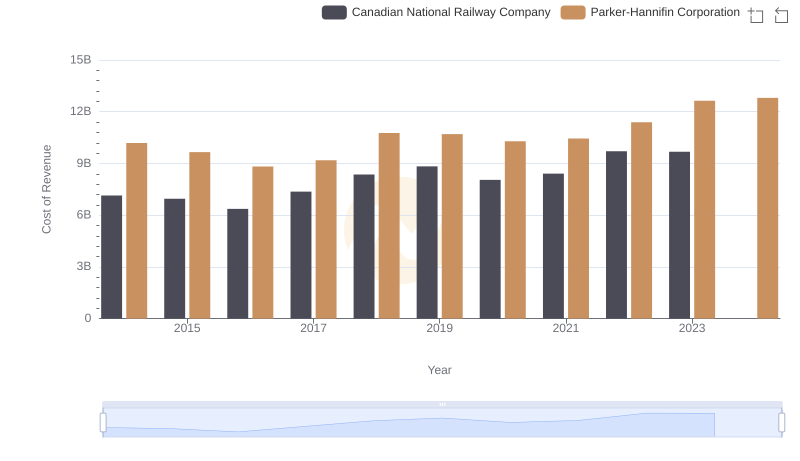
Cost of Revenue Trends: Parker-Hannifin Corporation vs Canadian National Railway Company
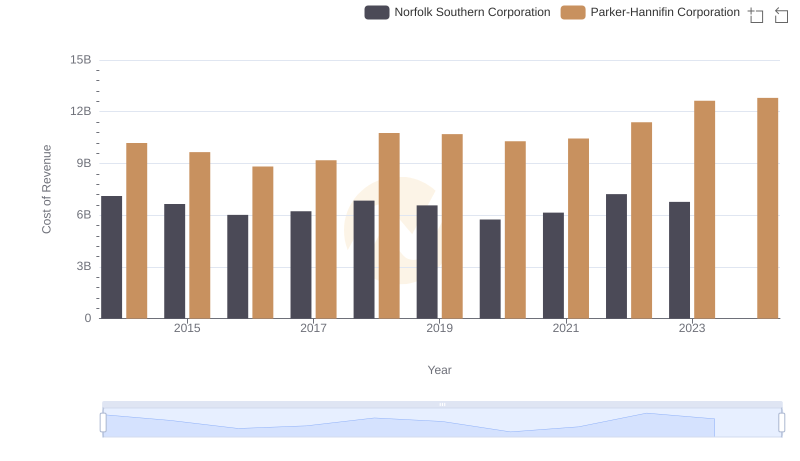
Analyzing Cost of Revenue: Parker-Hannifin Corporation and Norfolk Southern Corporation

Parker-Hannifin Corporation vs Roper Technologies, Inc.: A Gross Profit Performance Breakdown
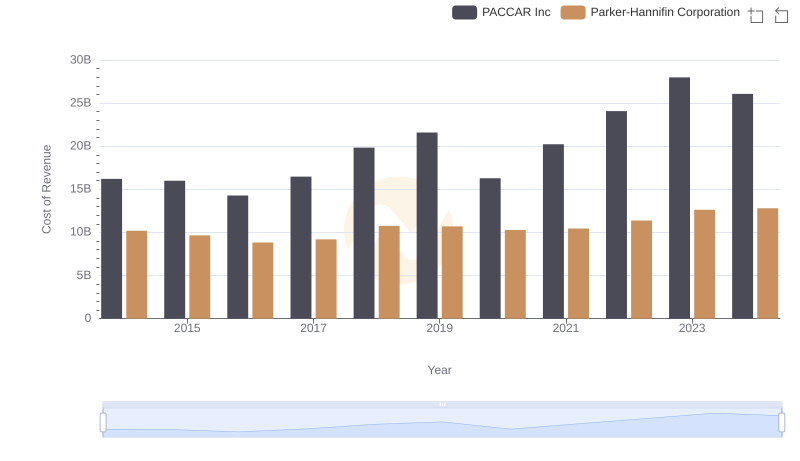
Comparing Cost of Revenue Efficiency: Parker-Hannifin Corporation vs PACCAR Inc
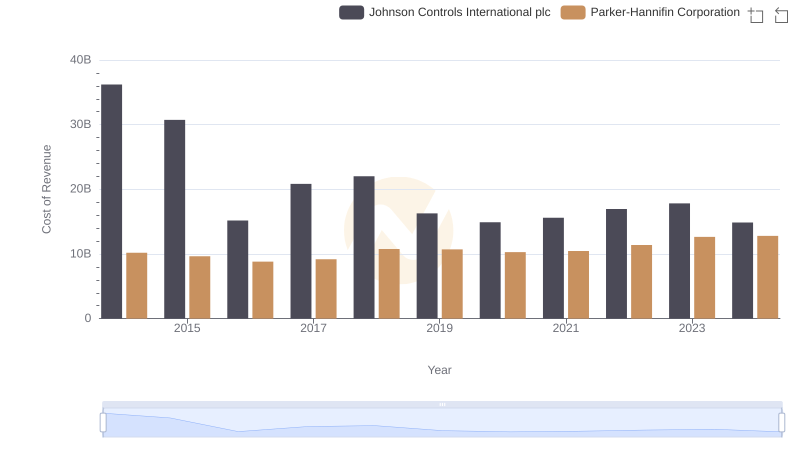
Cost of Revenue Comparison: Parker-Hannifin Corporation vs Johnson Controls International plc
R&D Spending Showdown: Parker-Hannifin Corporation vs Roper Technologies, Inc.

Parker-Hannifin Corporation and Roper Technologies, Inc.: SG&A Spending Patterns Compared

EBITDA Metrics Evaluated: Parker-Hannifin Corporation vs Roper Technologies, Inc.