| __timestamp | CSX Corporation | Parker-Hannifin Corporation |
|---|---|---|
| Wednesday, January 1, 2014 | 9056000000 | 10188227000 |
| Thursday, January 1, 2015 | 8227000000 | 9655245000 |
| Friday, January 1, 2016 | 7680000000 | 8823384000 |
| Sunday, January 1, 2017 | 7635000000 | 9188962000 |
| Monday, January 1, 2018 | 7477000000 | 10762841000 |
| Tuesday, January 1, 2019 | 7063000000 | 10703484000 |
| Wednesday, January 1, 2020 | 6221000000 | 10286518000 |
| Friday, January 1, 2021 | 7382000000 | 10449680000 |
| Saturday, January 1, 2022 | 9068000000 | 11387267000 |
| Sunday, January 1, 2023 | 9130000000 | 12635892000 |
| Monday, January 1, 2024 | 12801816000 |
Igniting the spark of knowledge
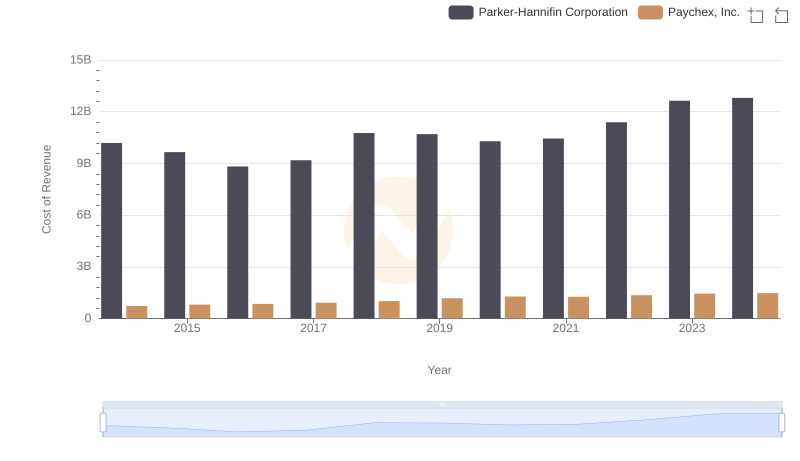
In the ever-evolving landscape of industrial and transportation sectors, understanding cost dynamics is crucial. Parker-Hannifin Corporation, a leader in motion and control technologies, and CSX Corporation, a major player in rail-based freight transportation, offer intriguing insights into cost management over the past decade. From 2014 to 2023, Parker-Hannifin's cost of revenue has shown a steady upward trend, peaking at approximately 12.6 billion in 2023, marking a 24% increase from 2014. In contrast, CSX Corporation experienced a more volatile trajectory, with costs dipping to a low in 2020 before rebounding to 9.13 billion in 2023, reflecting a 1% increase from 2014. This divergence highlights the distinct operational challenges and strategic responses of these industry giants. Notably, data for 2024 is incomplete, leaving room for speculation on future trends. Such insights are invaluable for investors and analysts seeking to navigate these complex markets.
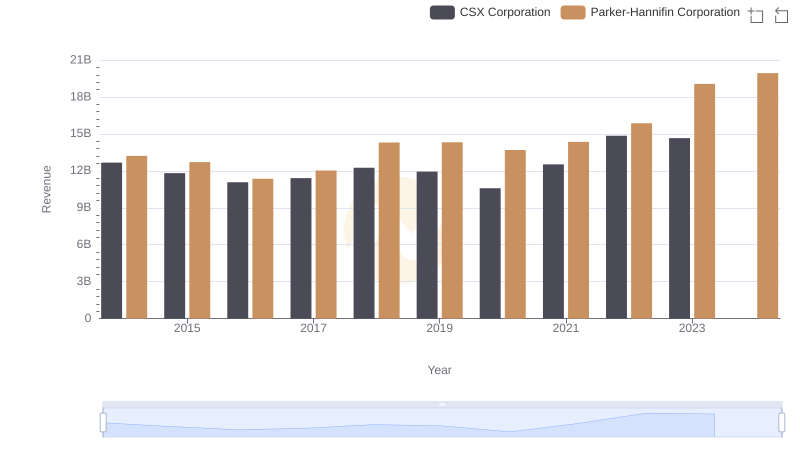
Comparing Revenue Performance: Parker-Hannifin Corporation or CSX Corporation?
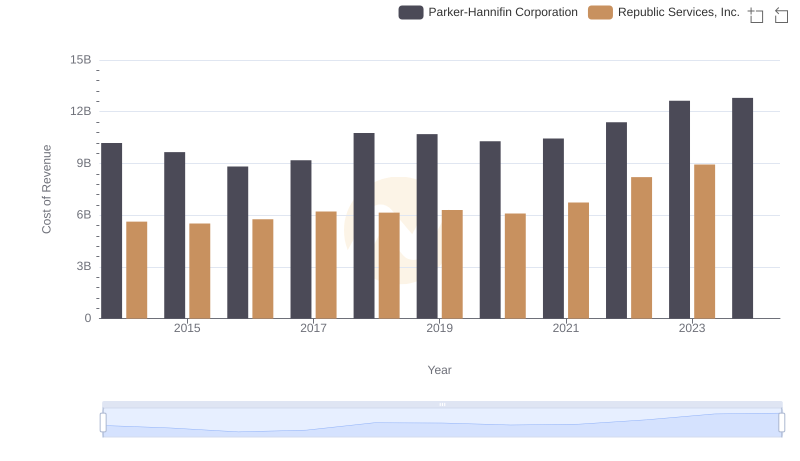
Cost of Revenue Comparison: Parker-Hannifin Corporation vs Republic Services, Inc.
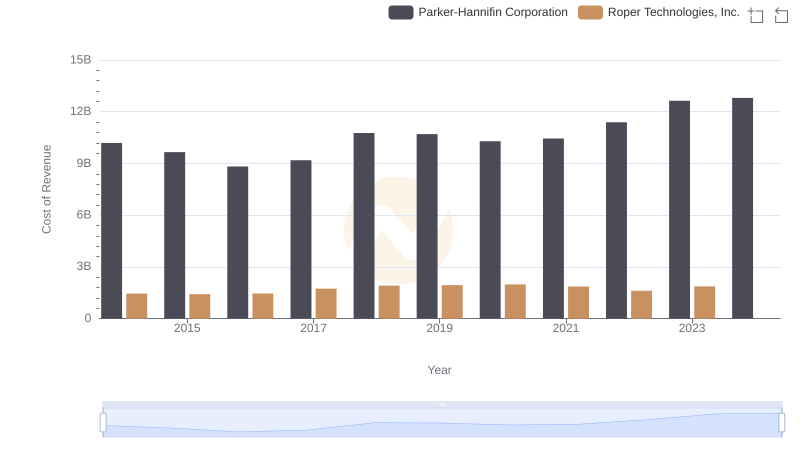
Cost Insights: Breaking Down Parker-Hannifin Corporation and Roper Technologies, Inc.'s Expenses
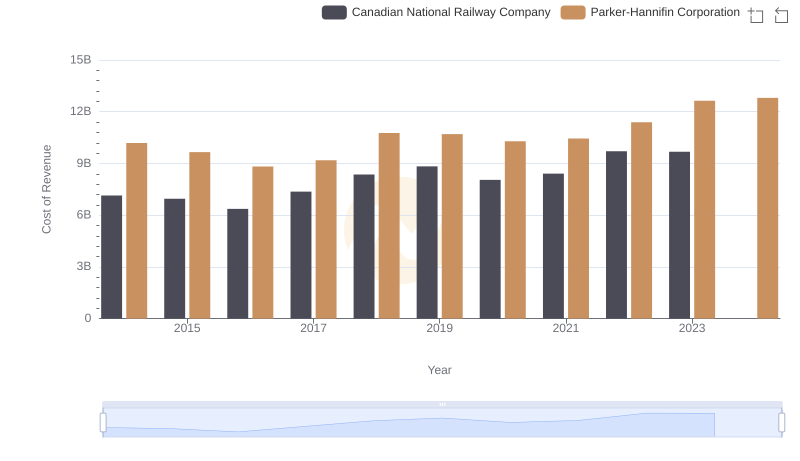
Cost of Revenue Trends: Parker-Hannifin Corporation vs Canadian National Railway Company

Parker-Hannifin Corporation vs CSX Corporation: A Gross Profit Performance Breakdown
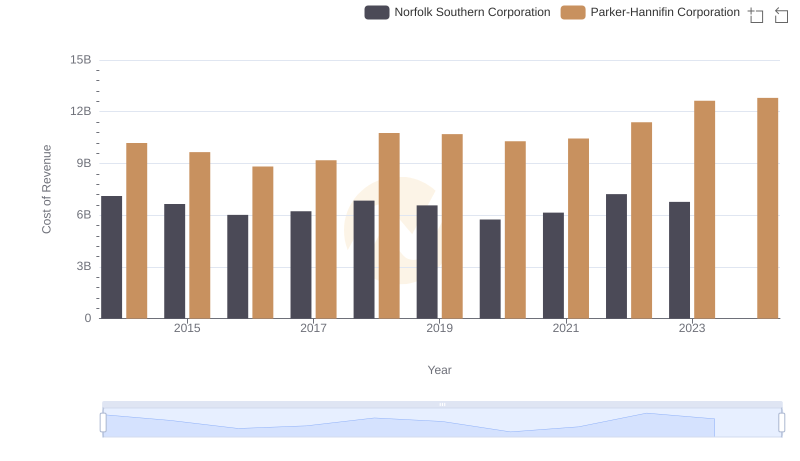
Analyzing Cost of Revenue: Parker-Hannifin Corporation and Norfolk Southern Corporation
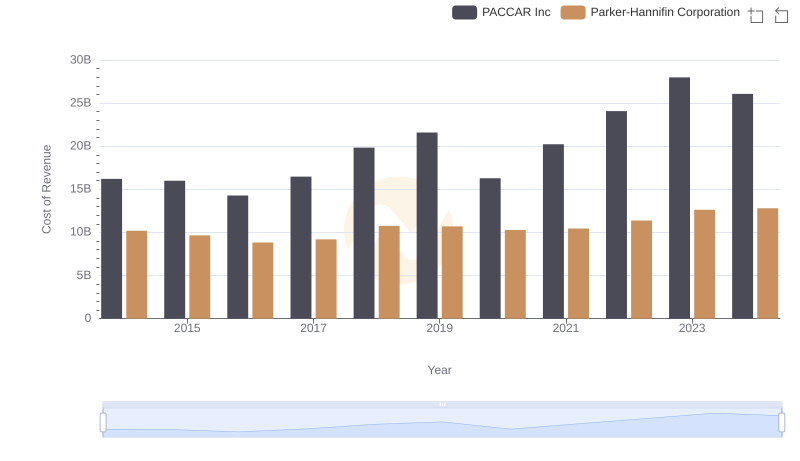
Comparing Cost of Revenue Efficiency: Parker-Hannifin Corporation vs PACCAR Inc
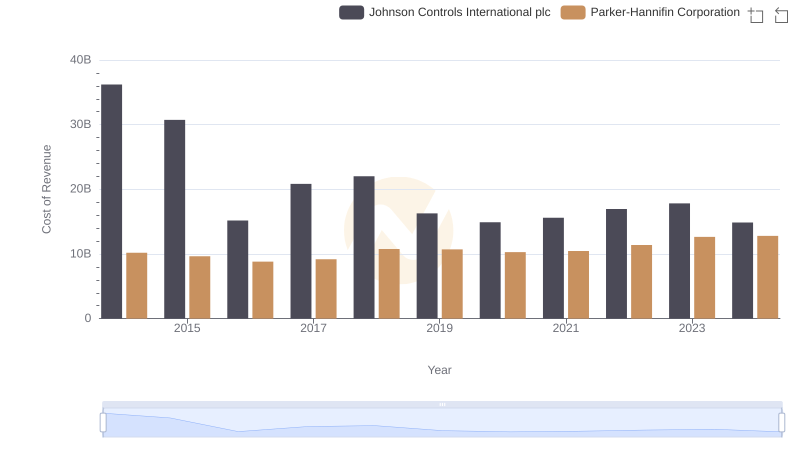
Cost of Revenue Comparison: Parker-Hannifin Corporation vs Johnson Controls International plc
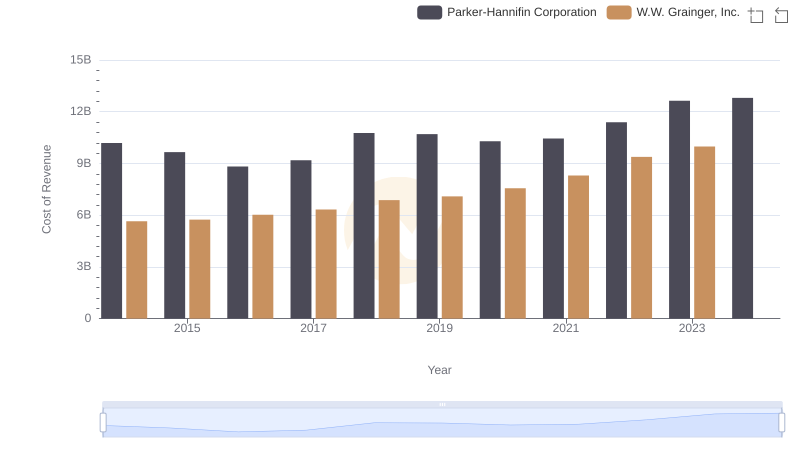
Comparing Cost of Revenue Efficiency: Parker-Hannifin Corporation vs W.W. Grainger, Inc.
Comparing Cost of Revenue Efficiency: Parker-Hannifin Corporation vs Paychex, Inc.