| __timestamp | Masco Corporation | Parker-Hannifin Corporation |
|---|---|---|
| Wednesday, January 1, 2014 | 8521000000 | 13215971000 |
| Thursday, January 1, 2015 | 7142000000 | 12711744000 |
| Friday, January 1, 2016 | 7357000000 | 11360753000 |
| Sunday, January 1, 2017 | 7644000000 | 12029312000 |
| Monday, January 1, 2018 | 8359000000 | 14302392000 |
| Tuesday, January 1, 2019 | 6707000000 | 14320324000 |
| Wednesday, January 1, 2020 | 7188000000 | 13695520000 |
| Friday, January 1, 2021 | 8375000000 | 14347640000 |
| Saturday, January 1, 2022 | 8680000000 | 15861608000 |
| Sunday, January 1, 2023 | 7967000000 | 19065194000 |
| Monday, January 1, 2024 | 7828000000 | 19929606000 |
Data in motion
In the ever-evolving landscape of industrial and home improvement sectors, Parker-Hannifin Corporation and Masco Corporation stand as titans. From 2014 to 2023, Parker-Hannifin's revenue surged by approximately 44%, peaking in 2023 with a remarkable $19 billion. This growth underscores its resilience and adaptability in a competitive market. Meanwhile, Masco Corporation experienced a more fluctuating journey, with revenues peaking in 2022 at nearly $8.7 billion, before a slight dip in 2023. This represents a 2% increase from 2014, highlighting its steady presence in the home improvement industry. Notably, 2024 data for Masco is missing, leaving room for speculation on its future trajectory. As these companies navigate economic shifts, their financial narratives offer valuable insights into industry trends and strategic positioning.
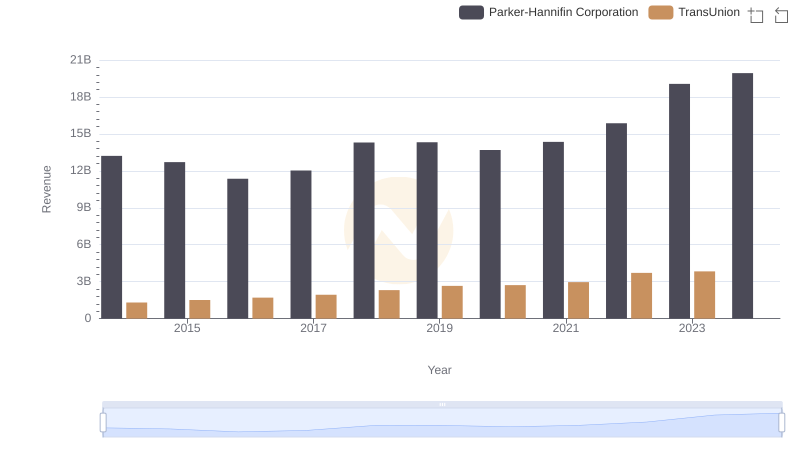
Parker-Hannifin Corporation or TransUnion: Who Leads in Yearly Revenue?
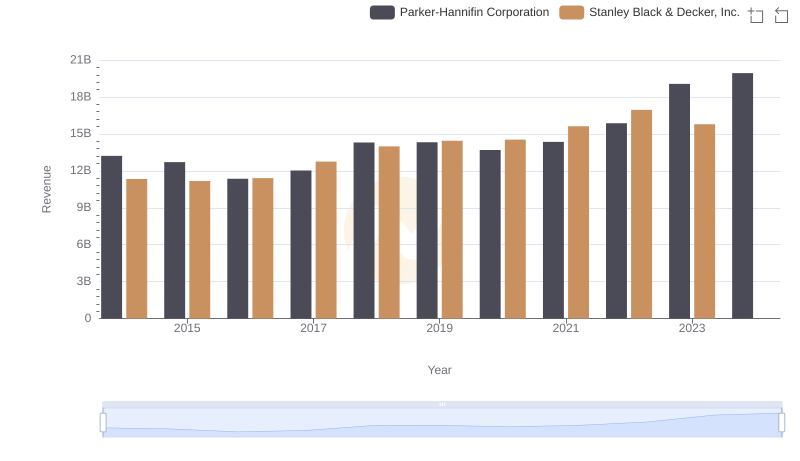
Parker-Hannifin Corporation and Stanley Black & Decker, Inc.: A Comprehensive Revenue Analysis
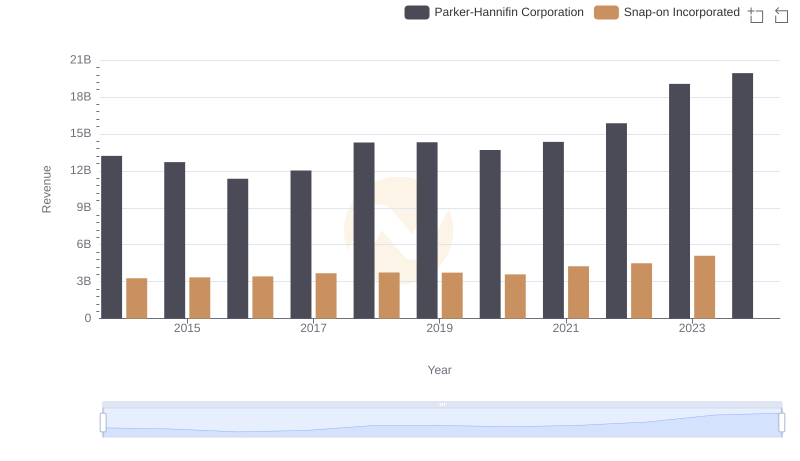
Revenue Showdown: Parker-Hannifin Corporation vs Snap-on Incorporated
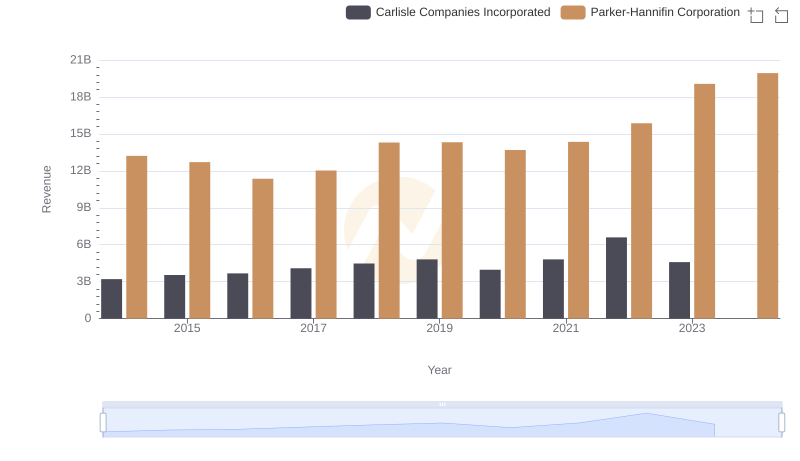
Parker-Hannifin Corporation vs Carlisle Companies Incorporated: Examining Key Revenue Metrics
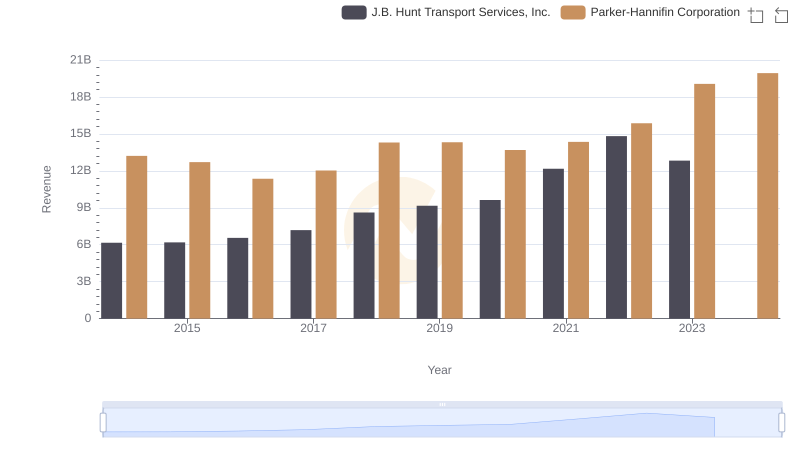
Parker-Hannifin Corporation or J.B. Hunt Transport Services, Inc.: Who Leads in Yearly Revenue?
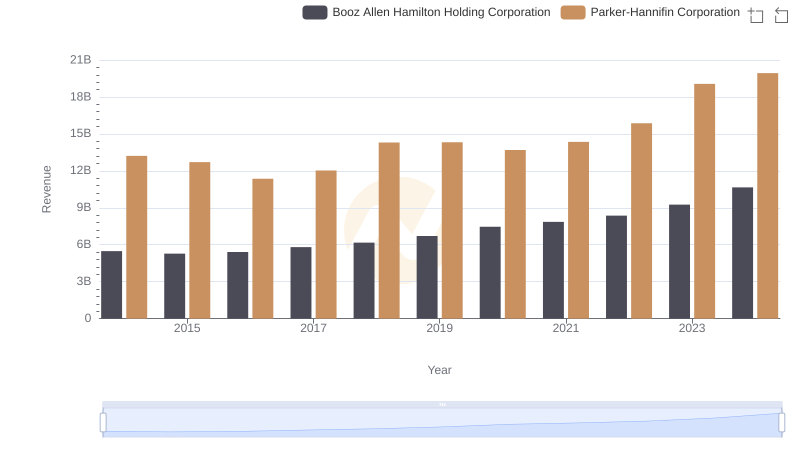
Revenue Showdown: Parker-Hannifin Corporation vs Booz Allen Hamilton Holding Corporation
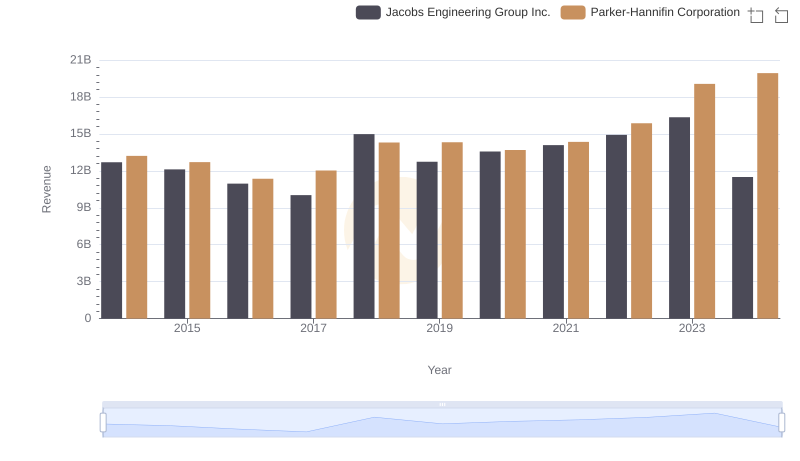
Parker-Hannifin Corporation or Jacobs Engineering Group Inc.: Who Leads in Yearly Revenue?
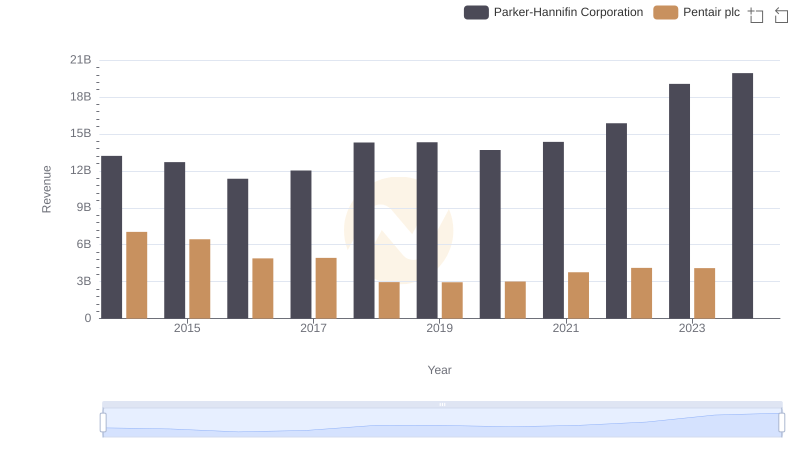
Annual Revenue Comparison: Parker-Hannifin Corporation vs Pentair plc
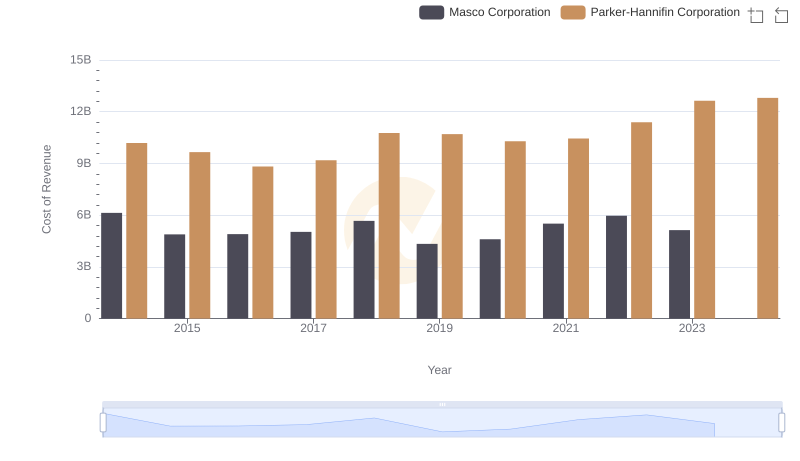
Analyzing Cost of Revenue: Parker-Hannifin Corporation and Masco Corporation
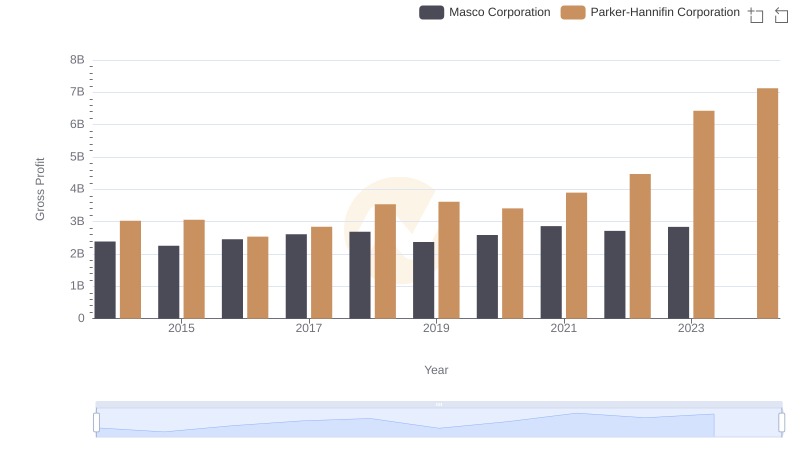
Who Generates Higher Gross Profit? Parker-Hannifin Corporation or Masco Corporation
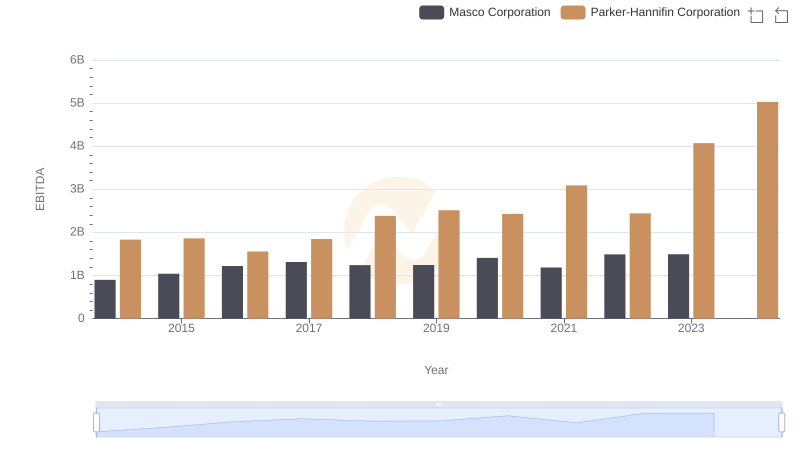
Professional EBITDA Benchmarking: Parker-Hannifin Corporation vs Masco Corporation