| __timestamp | International Business Machines Corporation | Nutanix, Inc. |
|---|---|---|
| Wednesday, January 1, 2014 | 5437000000 | 38037000 |
| Thursday, January 1, 2015 | 5247000000 | 73510000 |
| Friday, January 1, 2016 | 5726000000 | 116400000 |
| Sunday, January 1, 2017 | 5590000000 | 288619000 |
| Monday, January 1, 2018 | 5379000000 | 313777000 |
| Tuesday, January 1, 2019 | 5910000000 | 500719000 |
| Wednesday, January 1, 2020 | 6262000000 | 553978000 |
| Friday, January 1, 2021 | 6488000000 | 556950000 |
| Saturday, January 1, 2022 | 6567000000 | 571962000 |
| Sunday, January 1, 2023 | 6775000000 | 580961000 |
| Monday, January 1, 2024 | 0 | 638992000 |
Data in motion
In the ever-evolving world of technology, research and development (R&D) is the lifeblood of innovation. Over the past decade, International Business Machines Corporation (IBM) and Nutanix, Inc. have showcased contrasting approaches to R&D investment. IBM, a stalwart in the tech industry, consistently allocated substantial resources, peaking at approximately $6.8 billion in 2023. This represents a steady increase of about 25% from 2014. In contrast, Nutanix, a relative newcomer, has shown a remarkable growth trajectory, with R&D spending surging by over 1,500% from 2014 to 2023, reaching nearly $581 million. This stark difference highlights IBM's established dominance and Nutanix's aggressive push to innovate and compete. However, 2024 data for IBM is notably absent, leaving room for speculation on its future R&D strategy. As these companies forge ahead, their R&D investments will undoubtedly shape the tech landscape.
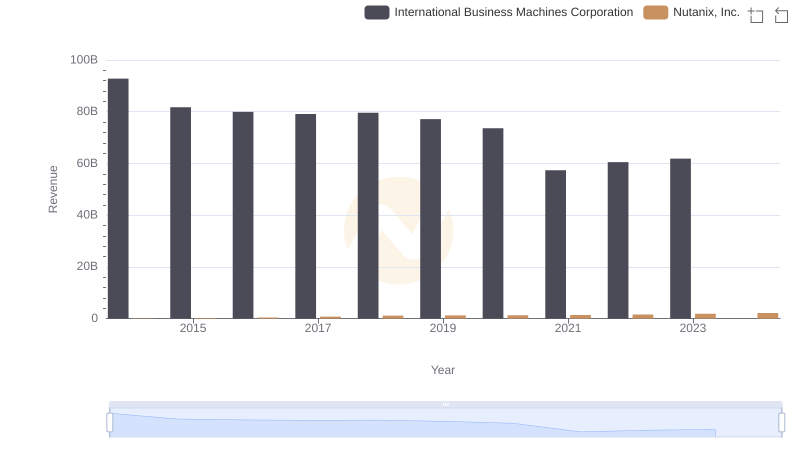
Comparing Revenue Performance: International Business Machines Corporation or Nutanix, Inc.?
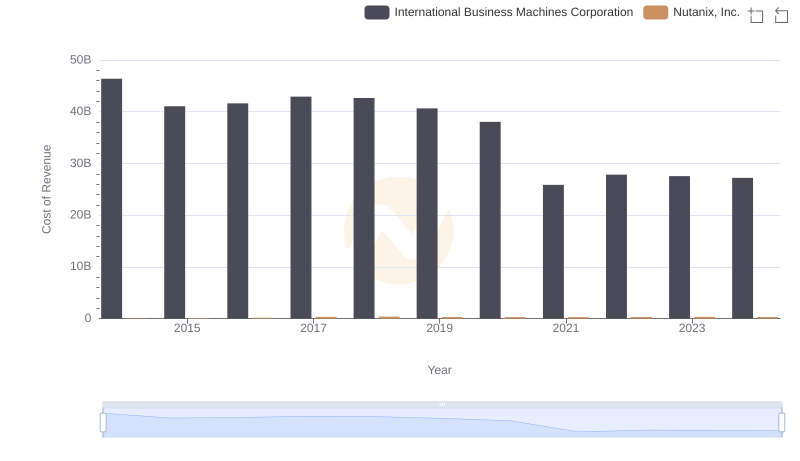
Analyzing Cost of Revenue: International Business Machines Corporation and Nutanix, Inc.
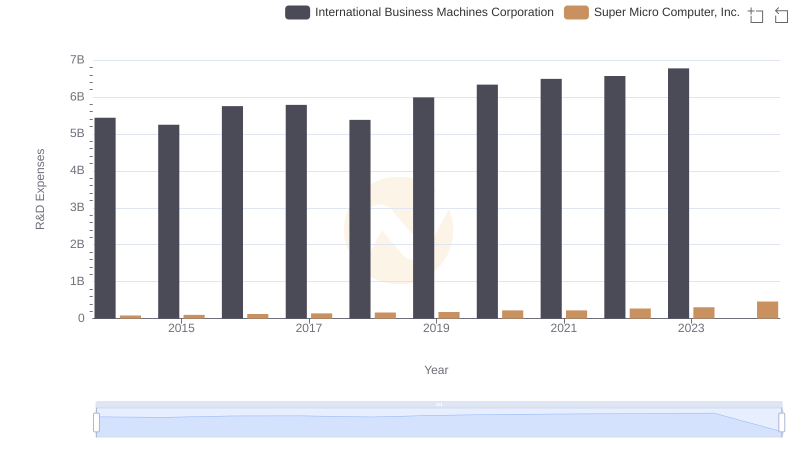
R&D Spending Showdown: International Business Machines Corporation vs Super Micro Computer, Inc.
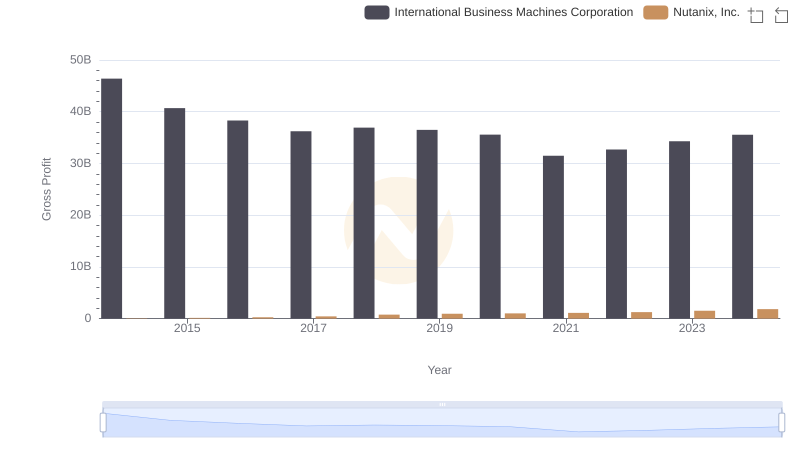
Gross Profit Analysis: Comparing International Business Machines Corporation and Nutanix, Inc.
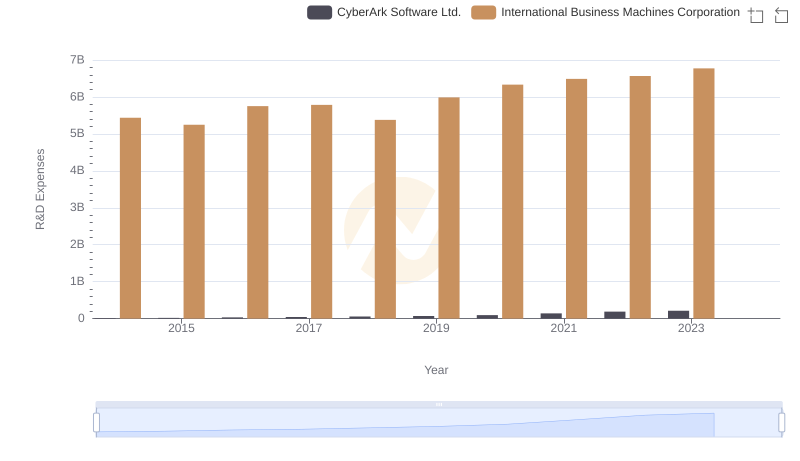
International Business Machines Corporation or CyberArk Software Ltd.: Who Invests More in Innovation?
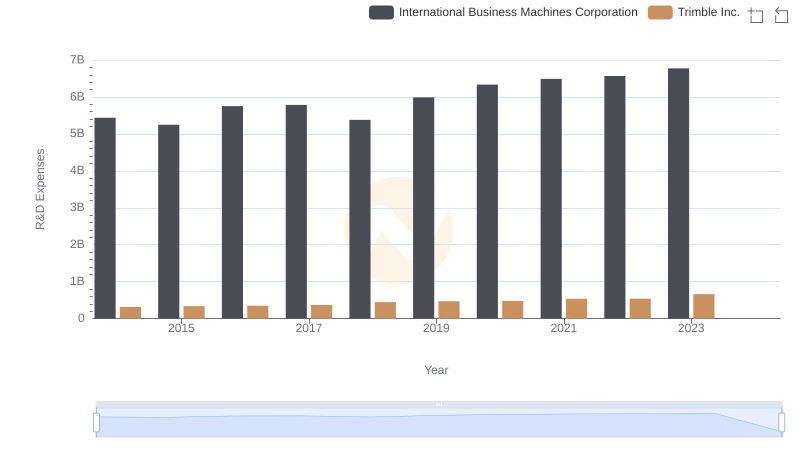
Analyzing R&D Budgets: International Business Machines Corporation vs Trimble Inc.
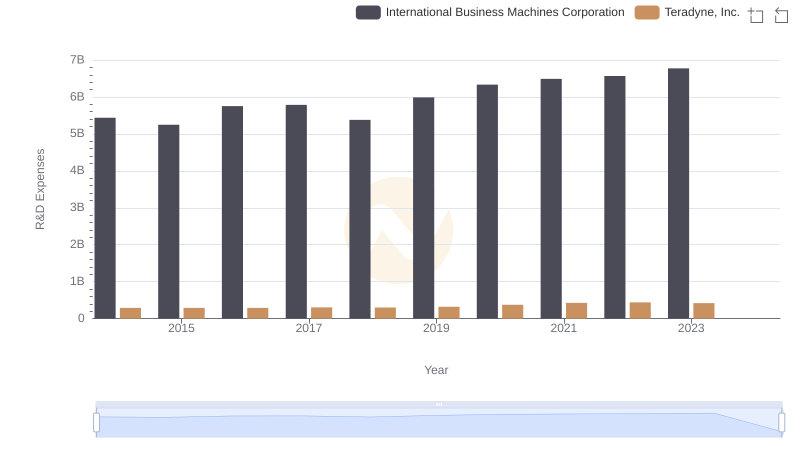
R&D Spending Showdown: International Business Machines Corporation vs Teradyne, Inc.
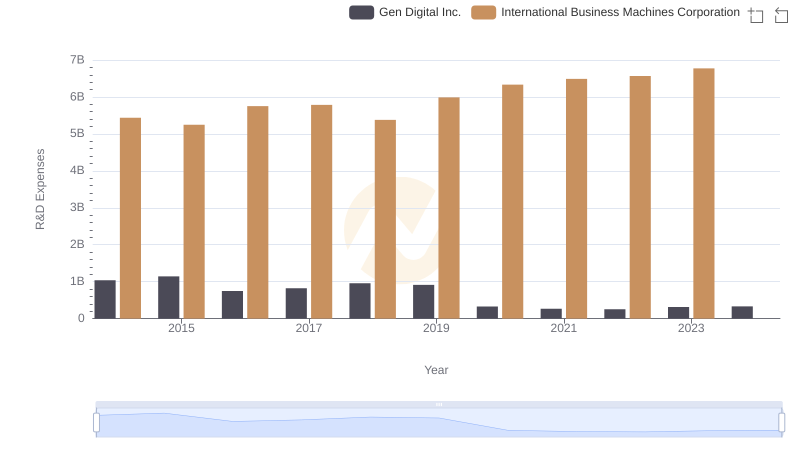
International Business Machines Corporation or Gen Digital Inc.: Who Invests More in Innovation?
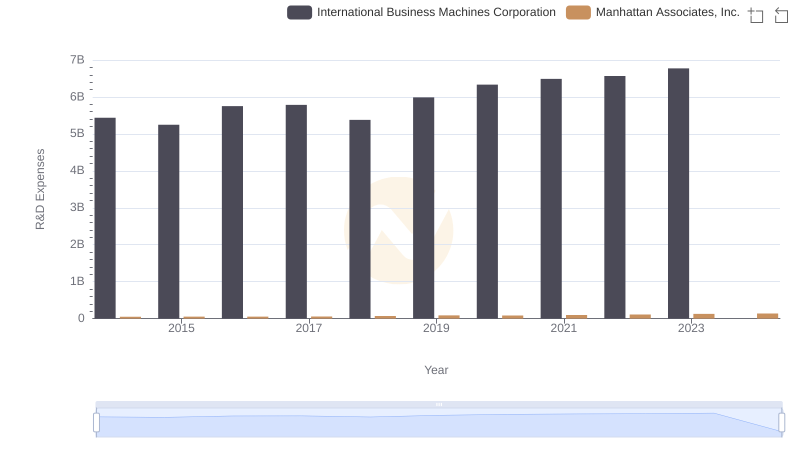
Research and Development: Comparing Key Metrics for International Business Machines Corporation and Manhattan Associates, Inc.
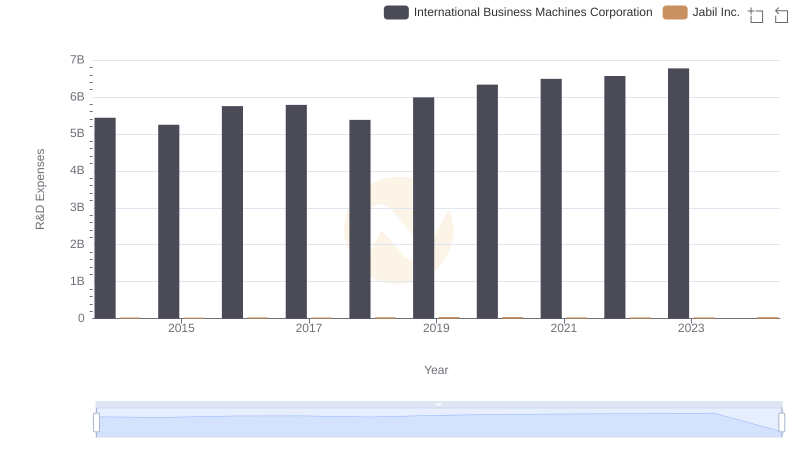
International Business Machines Corporation vs Jabil Inc.: Strategic Focus on R&D Spending
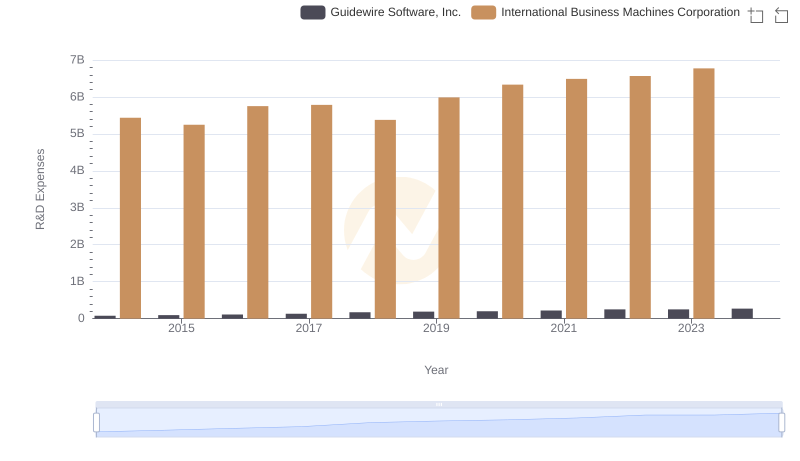
Comparing Innovation Spending: International Business Machines Corporation and Guidewire Software, Inc.
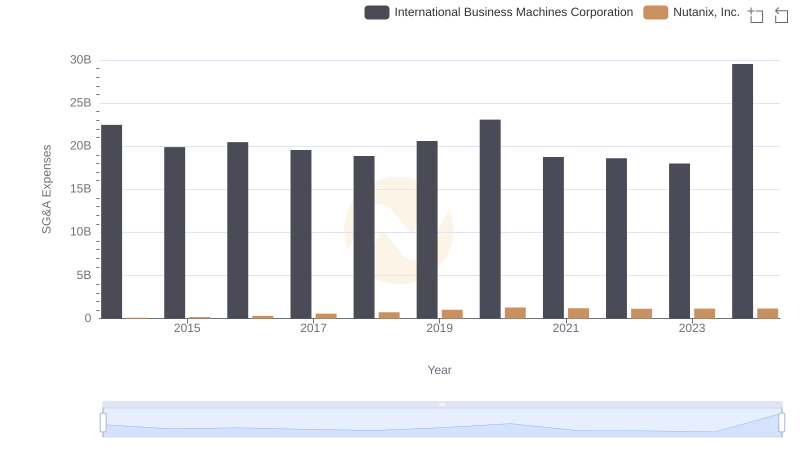
International Business Machines Corporation and Nutanix, Inc.: SG&A Spending Patterns Compared