| __timestamp | Equifax Inc. | TransUnion |
|---|---|---|
| Wednesday, January 1, 2014 | 844700000 | 499100000 |
| Thursday, January 1, 2015 | 887400000 | 531600000 |
| Friday, January 1, 2016 | 1113400000 | 579100000 |
| Sunday, January 1, 2017 | 1210700000 | 645700000 |
| Monday, January 1, 2018 | 1440400000 | 790100000 |
| Tuesday, January 1, 2019 | 1521700000 | 874100000 |
| Wednesday, January 1, 2020 | 1737400000 | 920400000 |
| Friday, January 1, 2021 | 1980900000 | 991600000 |
| Saturday, January 1, 2022 | 2177200000 | 1222900000 |
| Sunday, January 1, 2023 | 2335100000 | 1517300000 |
| Monday, January 1, 2024 | 0 | 0 |
In pursuit of knowledge
In the ever-evolving landscape of financial services, understanding the cost of revenue is crucial for evaluating a company's efficiency and profitability. Over the past decade, Equifax Inc. and TransUnion have shown distinct trends in their cost of revenue, reflecting their strategic priorities and market dynamics.
From 2014 to 2023, Equifax Inc. experienced a steady increase in its cost of revenue, growing by approximately 176%. This upward trajectory highlights the company's expanding operations and investments in data security and analytics. In contrast, TransUnion's cost of revenue rose by about 204% during the same period, indicating its aggressive market expansion and technological advancements.
These trends underscore the competitive nature of the credit reporting industry, where both companies strive to enhance their service offerings while managing operational costs. As we move forward, monitoring these financial metrics will provide valuable insights into their strategic directions and market positioning.
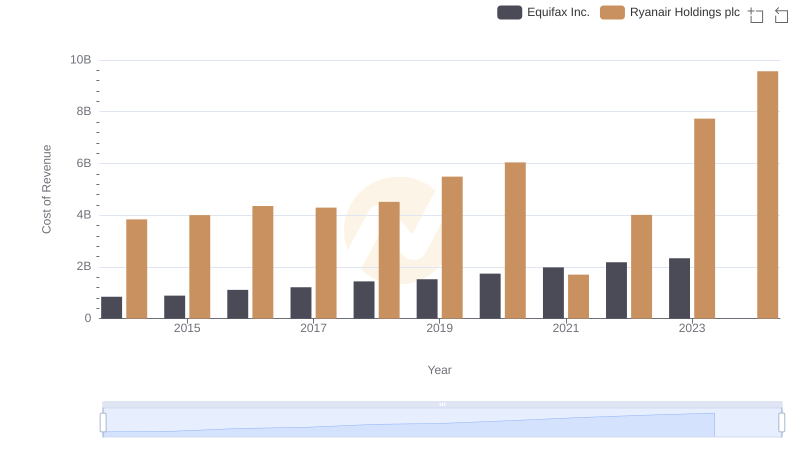
Equifax Inc. vs Ryanair Holdings plc: Efficiency in Cost of Revenue Explored
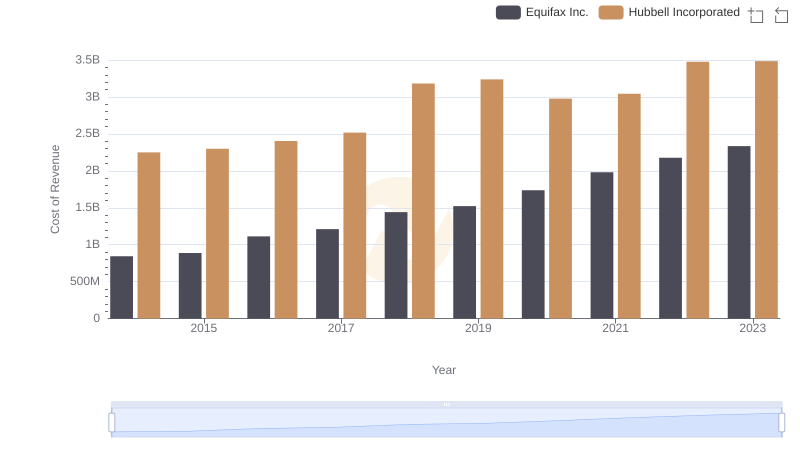
Cost Insights: Breaking Down Equifax Inc. and Hubbell Incorporated's Expenses
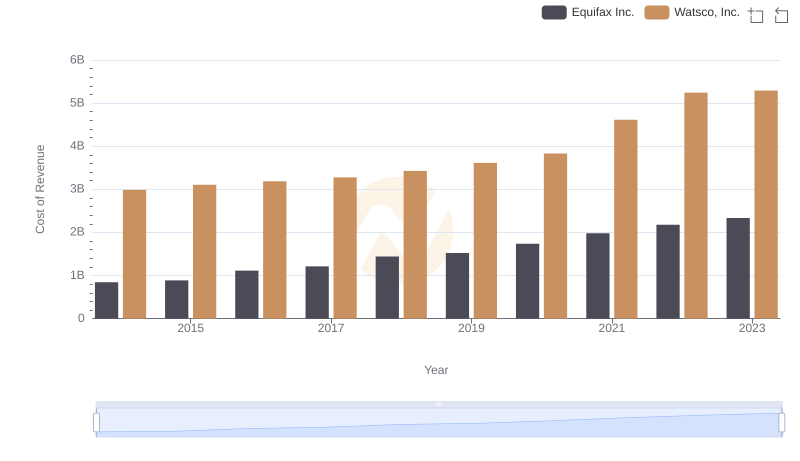
Cost of Revenue: Key Insights for Equifax Inc. and Watsco, Inc.
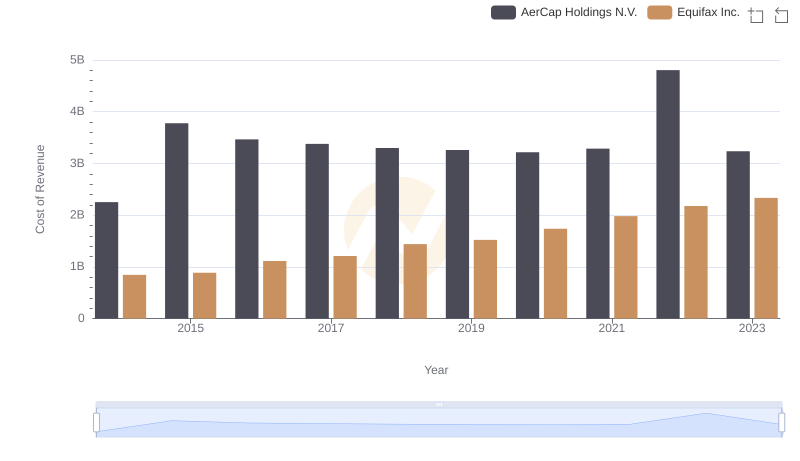
Analyzing Cost of Revenue: Equifax Inc. and AerCap Holdings N.V.
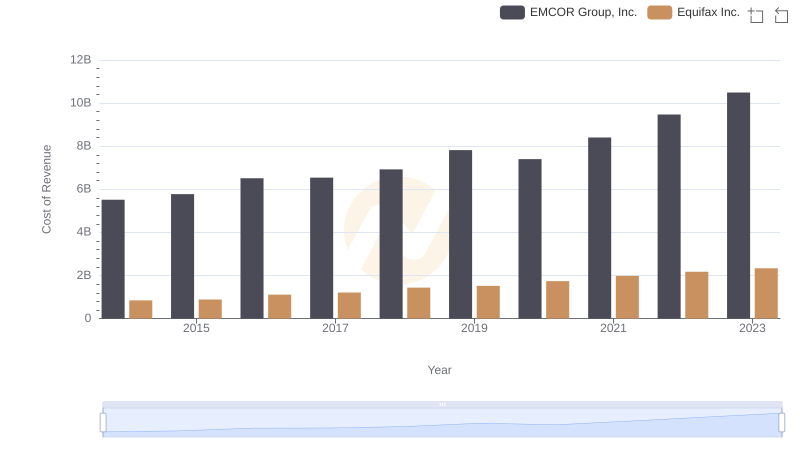
Equifax Inc. vs EMCOR Group, Inc.: Efficiency in Cost of Revenue Explored
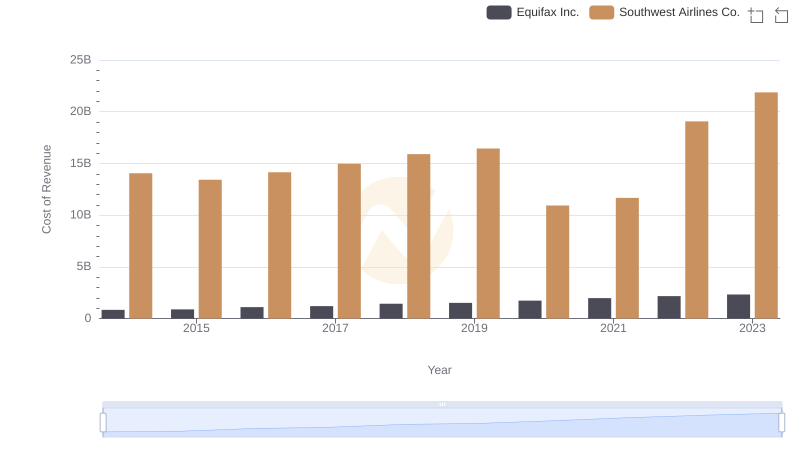
Equifax Inc. vs Southwest Airlines Co.: Efficiency in Cost of Revenue Explored
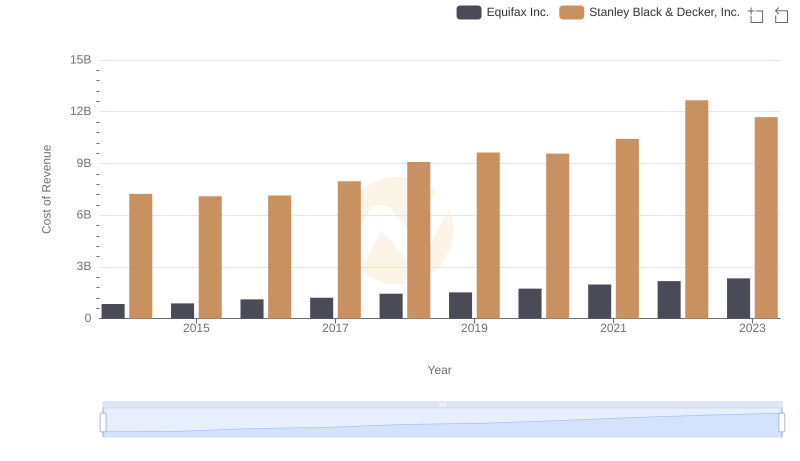
Cost Insights: Breaking Down Equifax Inc. and Stanley Black & Decker, Inc.'s Expenses
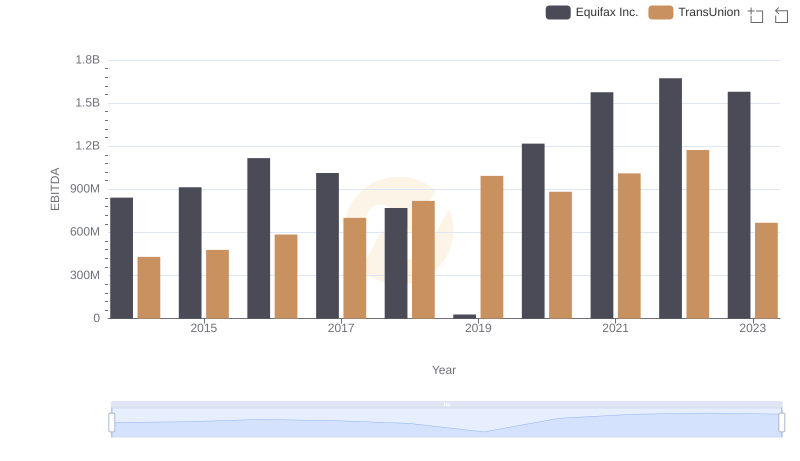
EBITDA Performance Review: Equifax Inc. vs TransUnion