| __timestamp | Equifax Inc. | Stanley Black & Decker, Inc. |
|---|---|---|
| Wednesday, January 1, 2014 | 844700000 | 7235900000 |
| Thursday, January 1, 2015 | 887400000 | 7099800000 |
| Friday, January 1, 2016 | 1113400000 | 7139700000 |
| Sunday, January 1, 2017 | 1210700000 | 7969200000 |
| Monday, January 1, 2018 | 1440400000 | 9080500000 |
| Tuesday, January 1, 2019 | 1521700000 | 9636700000 |
| Wednesday, January 1, 2020 | 1737400000 | 9566700000 |
| Friday, January 1, 2021 | 1980900000 | 10423000000 |
| Saturday, January 1, 2022 | 2177200000 | 12663300000 |
| Sunday, January 1, 2023 | 2335100000 | 11683100000 |
| Monday, January 1, 2024 | 0 | 10851300000 |
Infusing magic into the data realm
In the ever-evolving landscape of corporate finance, understanding cost structures is pivotal. Over the past decade, Equifax Inc. and Stanley Black & Decker, Inc. have showcased intriguing trends in their cost of revenue. From 2014 to 2023, Equifax's cost of revenue surged by approximately 176%, reflecting a strategic expansion and adaptation to market demands. Meanwhile, Stanley Black & Decker's expenses grew by about 61%, indicating a steady yet robust growth trajectory.
These insights offer a window into the financial strategies of two industry giants, providing valuable lessons in cost management and growth adaptation.
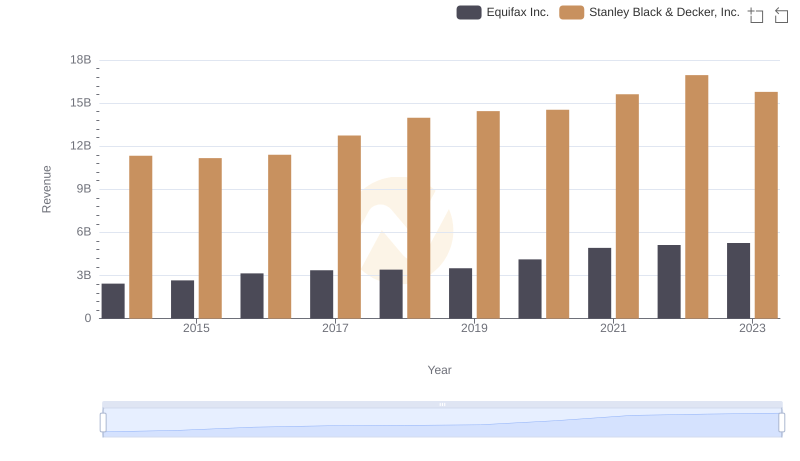
Equifax Inc. or Stanley Black & Decker, Inc.: Who Leads in Yearly Revenue?
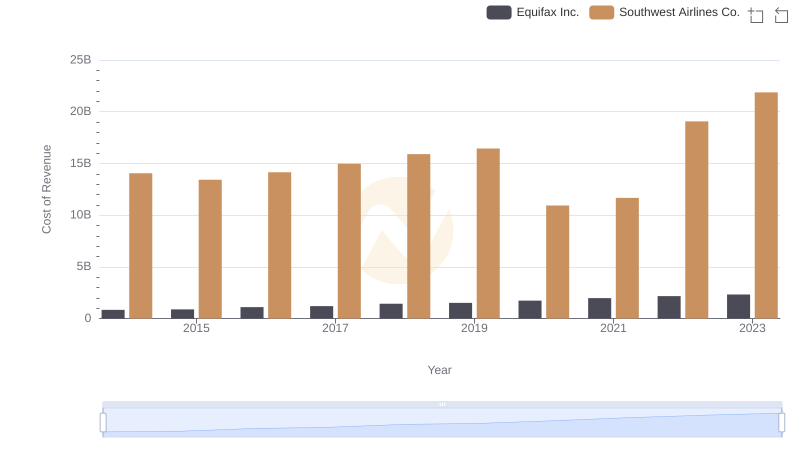
Equifax Inc. vs Southwest Airlines Co.: Efficiency in Cost of Revenue Explored
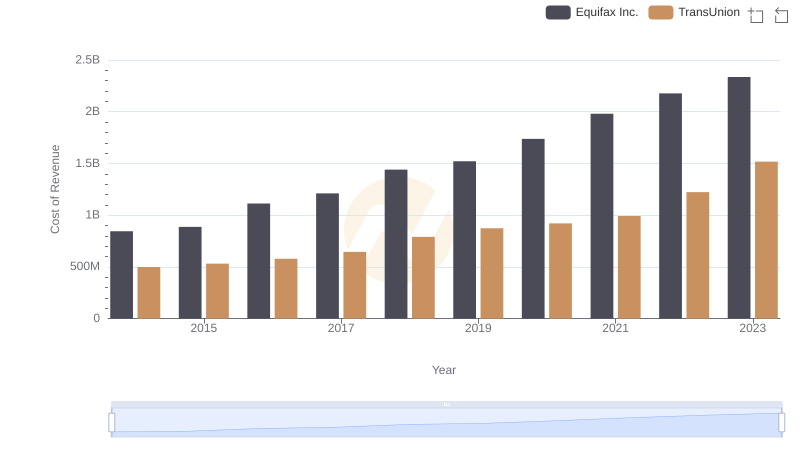
Analyzing Cost of Revenue: Equifax Inc. and TransUnion

Equifax Inc. vs Stanley Black & Decker, Inc.: A Gross Profit Performance Breakdown
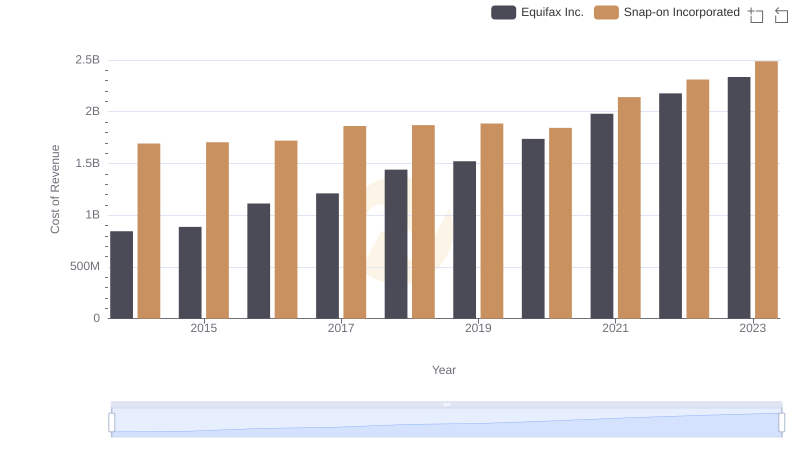
Equifax Inc. vs Snap-on Incorporated: Efficiency in Cost of Revenue Explored
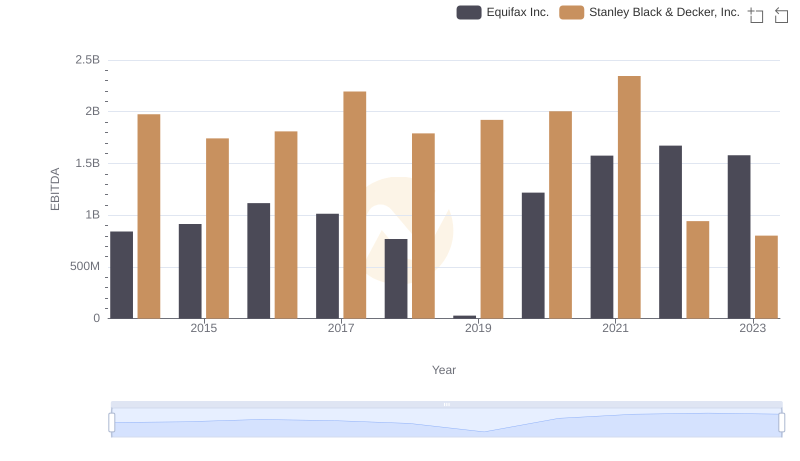
Comparative EBITDA Analysis: Equifax Inc. vs Stanley Black & Decker, Inc.
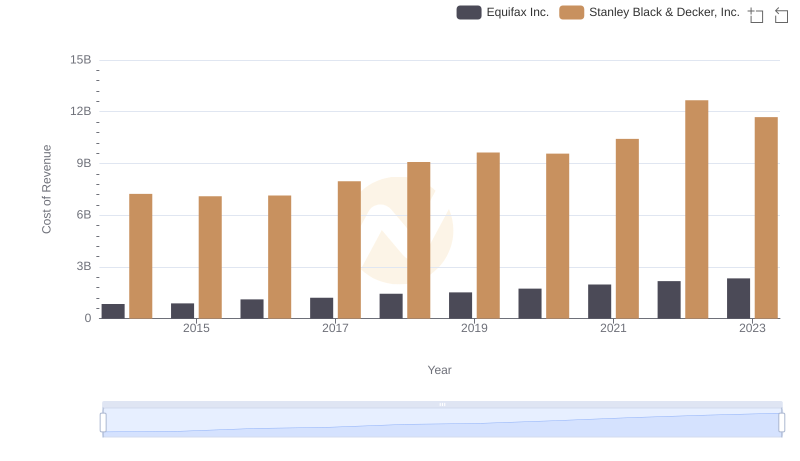
Cost of Revenue Trends: Equifax Inc. vs Stanley Black & Decker, Inc.
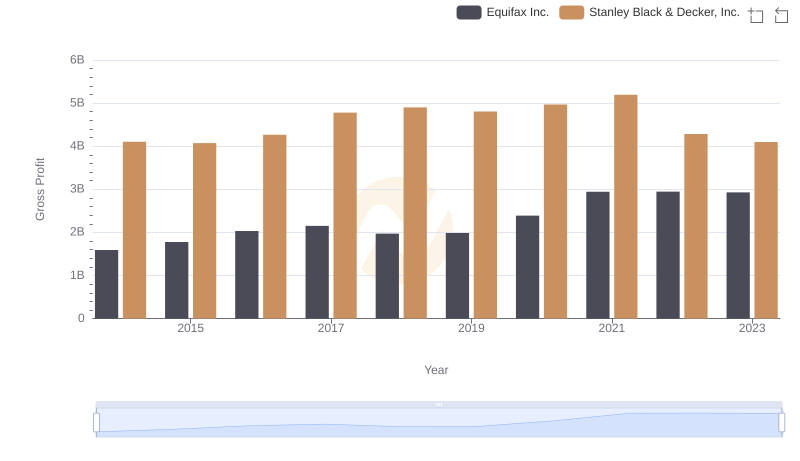
Key Insights on Gross Profit: Equifax Inc. vs Stanley Black & Decker, Inc.