| __timestamp | Cisco Systems, Inc. | VMware, Inc. |
|---|---|---|
| Wednesday, January 1, 2014 | 11437000000 | 2234000000 |
| Thursday, January 1, 2015 | 11861000000 | 2836000000 |
| Friday, January 1, 2016 | 11433000000 | 3033000000 |
| Sunday, January 1, 2017 | 11177000000 | 3046000000 |
| Monday, January 1, 2018 | 11386000000 | 3247000000 |
| Tuesday, January 1, 2019 | 11398000000 | 3682000000 |
| Wednesday, January 1, 2020 | 11094000000 | 4970000000 |
| Friday, January 1, 2021 | 11411000000 | 4478000000 |
| Saturday, January 1, 2022 | 11186000000 | 5135000000 |
| Sunday, January 1, 2023 | 12358000000 | 5521000000 |
| Monday, January 1, 2024 | 13177000000 |
Infusing magic into the data realm
In the ever-evolving tech landscape, effective cost management is crucial for sustaining growth and innovation. This analysis delves into the Selling, General, and Administrative (SG&A) expenses of Cisco Systems, Inc. and VMware, Inc. from 2014 to 2023. Over this decade, Cisco's SG&A expenses have shown a steady increase, peaking at approximately 13% higher in 2023 compared to 2014. Meanwhile, VMware's expenses have surged by nearly 147% during the same period, reflecting its aggressive expansion strategy.
Cisco's expenses remained relatively stable, with a notable spike in 2023, suggesting strategic investments or operational shifts. In contrast, VMware's consistent rise in SG&A expenses highlights its focus on scaling operations and market presence. The absence of data for 2024 suggests a potential shift or restructuring. Understanding these trends offers valuable insights into the financial strategies of these tech leaders.
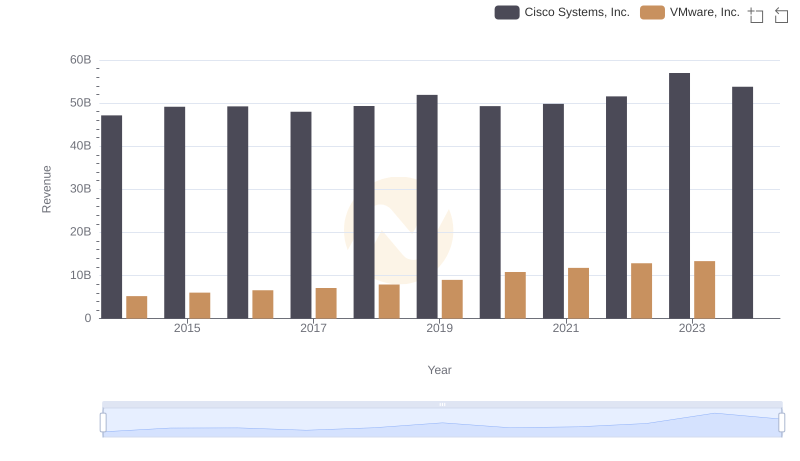
Annual Revenue Comparison: Cisco Systems, Inc. vs VMware, Inc.
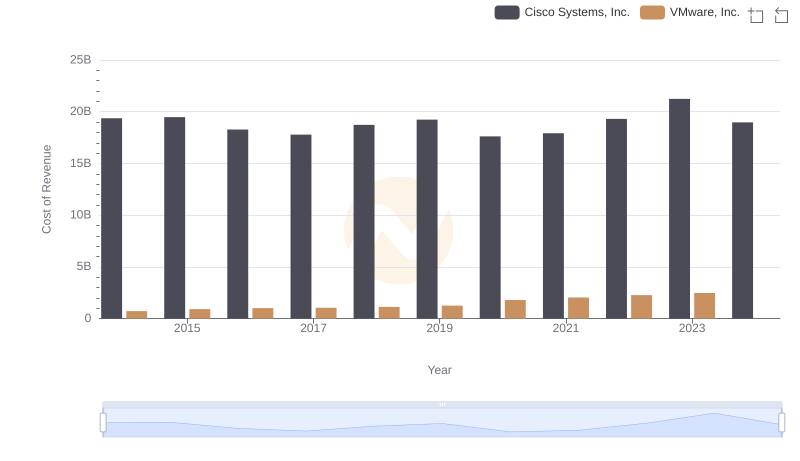
Analyzing Cost of Revenue: Cisco Systems, Inc. and VMware, Inc.
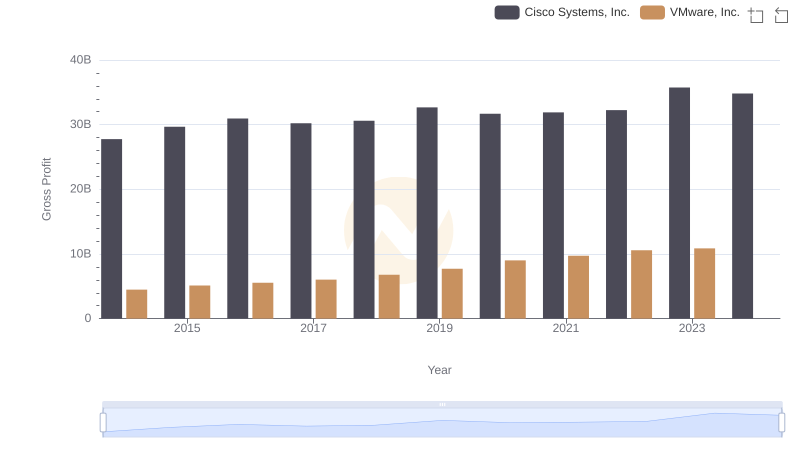
Cisco Systems, Inc. vs VMware, Inc.: A Gross Profit Performance Breakdown
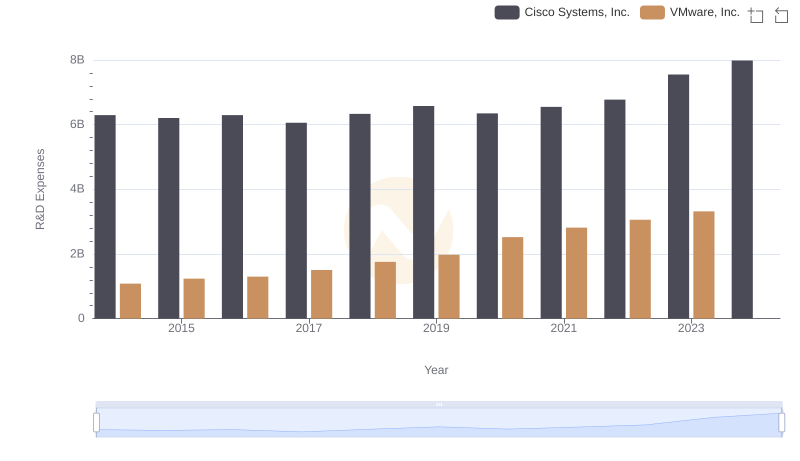
Cisco Systems, Inc. or VMware, Inc.: Who Invests More in Innovation?
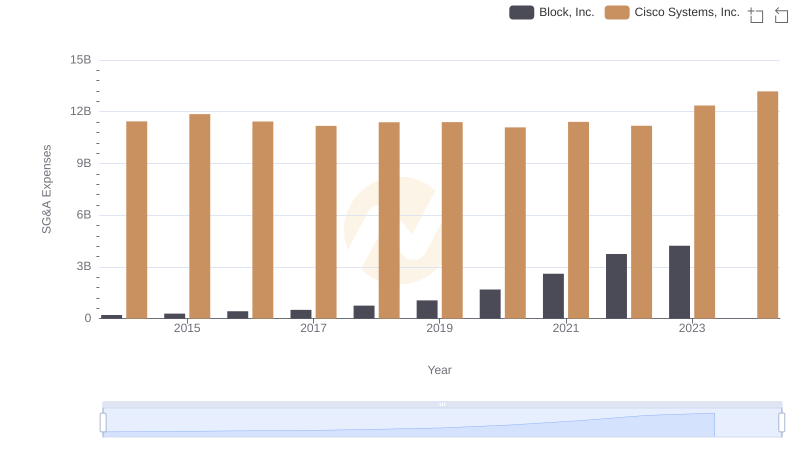
SG&A Efficiency Analysis: Comparing Cisco Systems, Inc. and Block, Inc.
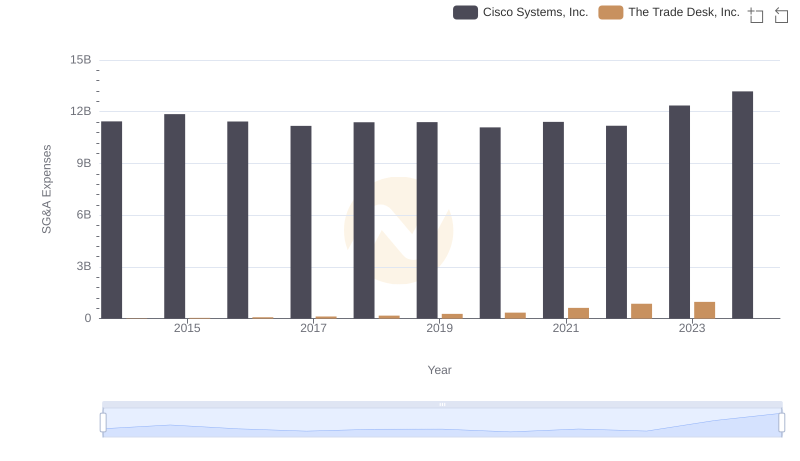
Cost Management Insights: SG&A Expenses for Cisco Systems, Inc. and The Trade Desk, Inc.
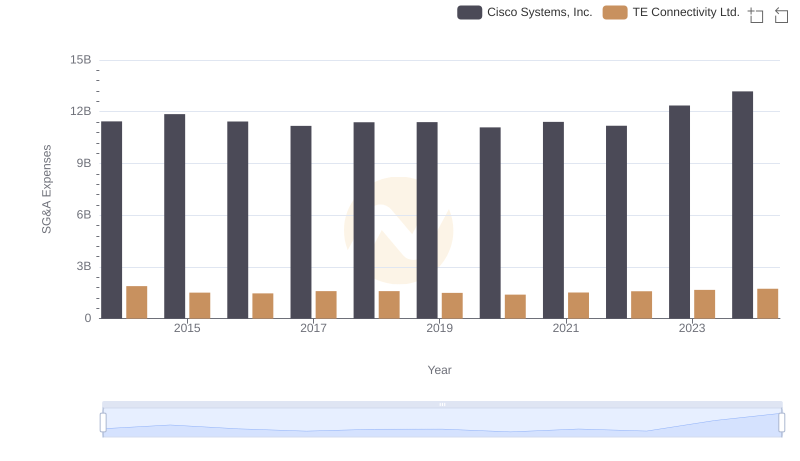
Who Optimizes SG&A Costs Better? Cisco Systems, Inc. or TE Connectivity Ltd.
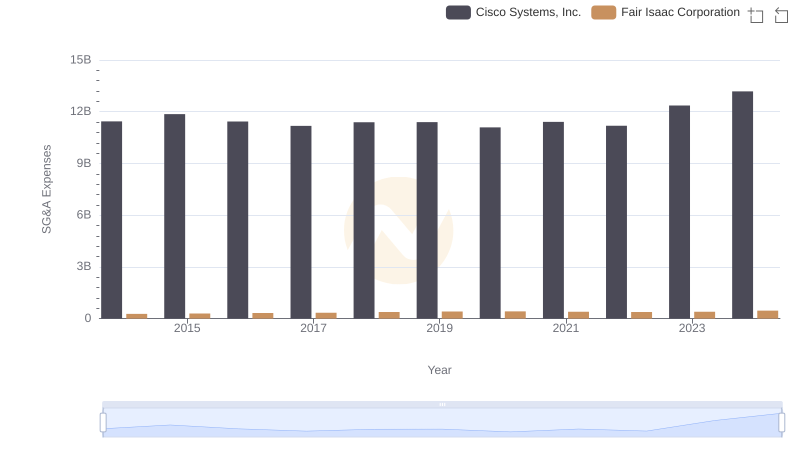
SG&A Efficiency Analysis: Comparing Cisco Systems, Inc. and Fair Isaac Corporation
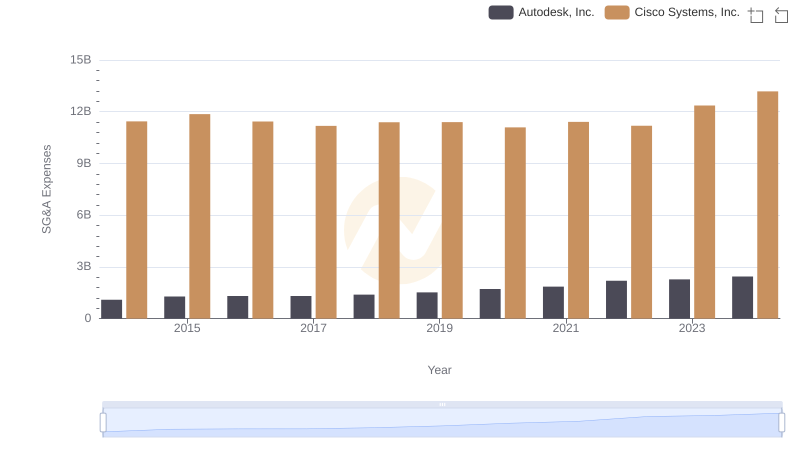
Breaking Down SG&A Expenses: Cisco Systems, Inc. vs Autodesk, Inc.
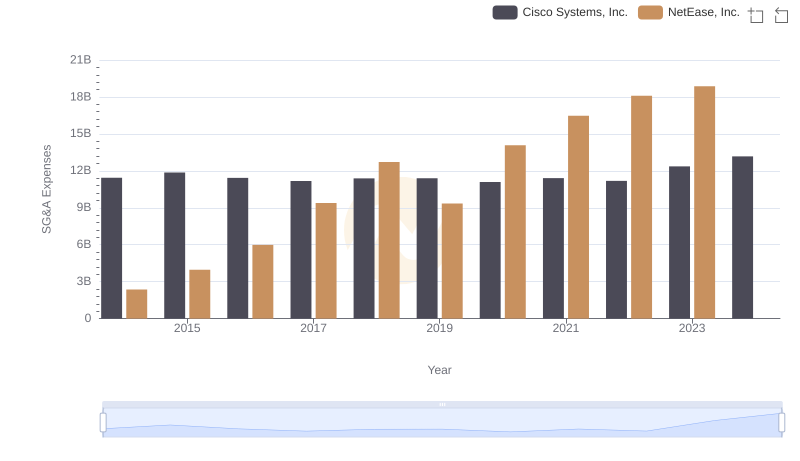
Selling, General, and Administrative Costs: Cisco Systems, Inc. vs NetEase, Inc.
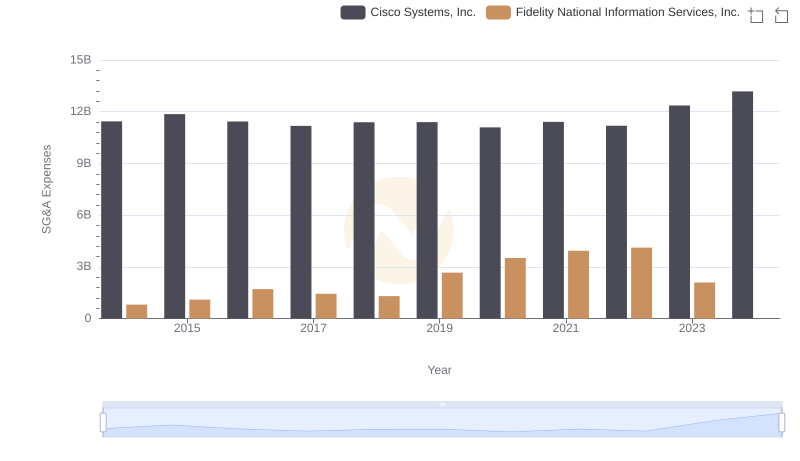
Breaking Down SG&A Expenses: Cisco Systems, Inc. vs Fidelity National Information Services, Inc.
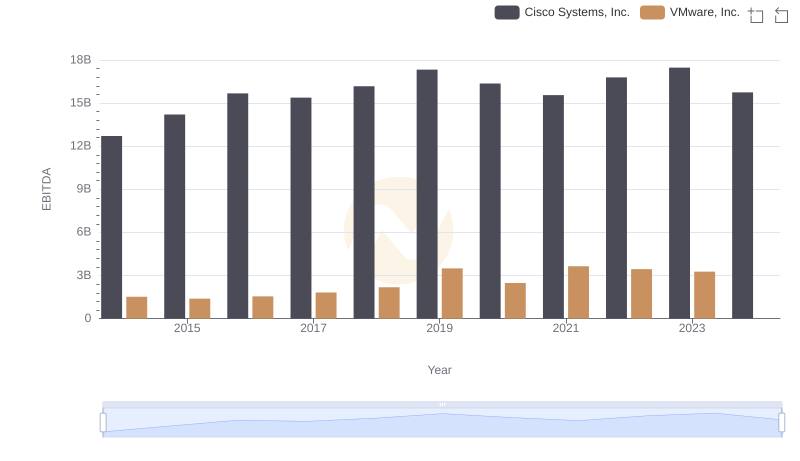
Cisco Systems, Inc. and VMware, Inc.: A Detailed Examination of EBITDA Performance