| __timestamp | Cintas Corporation | Owens Corning |
|---|---|---|
| Wednesday, January 1, 2014 | 4551812000 | 5276000000 |
| Thursday, January 1, 2015 | 4476886000 | 5350000000 |
| Friday, January 1, 2016 | 4905458000 | 5677000000 |
| Sunday, January 1, 2017 | 5323381000 | 6384000000 |
| Monday, January 1, 2018 | 6476632000 | 7057000000 |
| Tuesday, January 1, 2019 | 6892303000 | 7160000000 |
| Wednesday, January 1, 2020 | 7085120000 | 7055000000 |
| Friday, January 1, 2021 | 7116340000 | 8498000000 |
| Saturday, January 1, 2022 | 7854459000 | 9761000000 |
| Sunday, January 1, 2023 | 8815769000 | 9677000000 |
| Monday, January 1, 2024 | 9596615000 |
Igniting the spark of knowledge
In the ever-evolving landscape of American industry, Cintas Corporation and Owens Corning stand as paragons of resilience and growth. Over the past decade, these companies have demonstrated remarkable revenue trajectories, with Cintas Corporation experiencing a robust 111% increase from 2014 to 2023. Meanwhile, Owens Corning has seen a commendable 83% rise in the same period, despite a slight dip in 2023.
Cintas Corporation, a leader in corporate identity uniforms, has consistently expanded its market share, with revenues peaking in 2024. Owens Corning, a stalwart in building materials, reached its zenith in 2022, showcasing its adaptability in a competitive market. The data reveals a compelling narrative of strategic growth and market adaptation, underscoring the importance of innovation and resilience in the face of economic challenges.
Explore the chart to delve deeper into the financial journeys of these industrial giants.
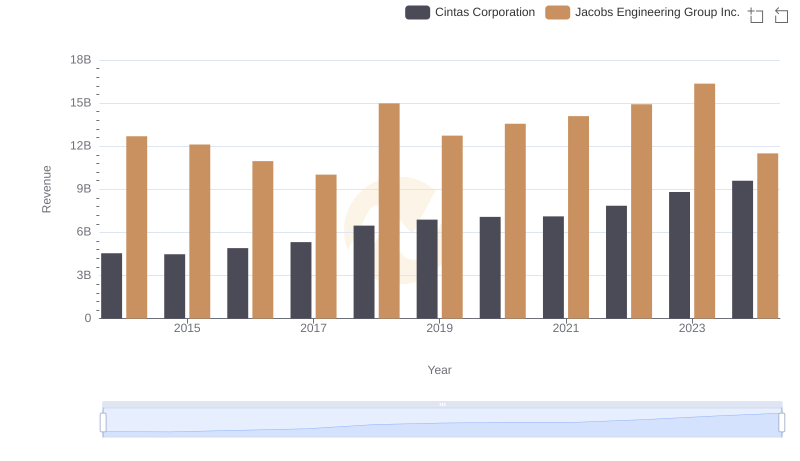
Comparing Revenue Performance: Cintas Corporation or Jacobs Engineering Group Inc.?
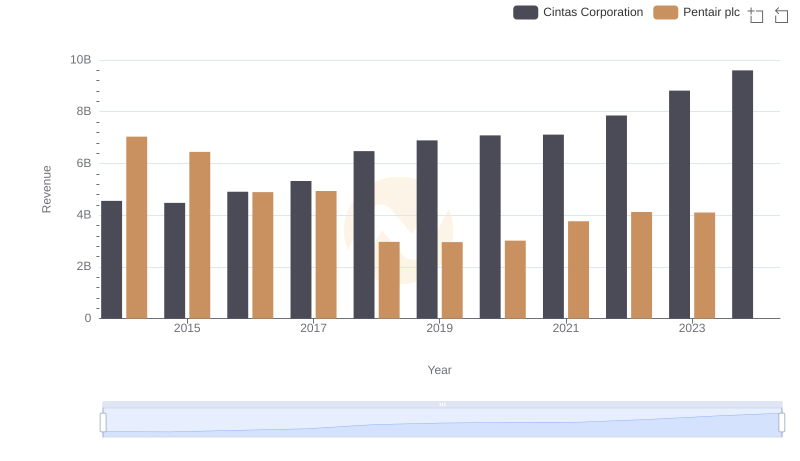
Annual Revenue Comparison: Cintas Corporation vs Pentair plc
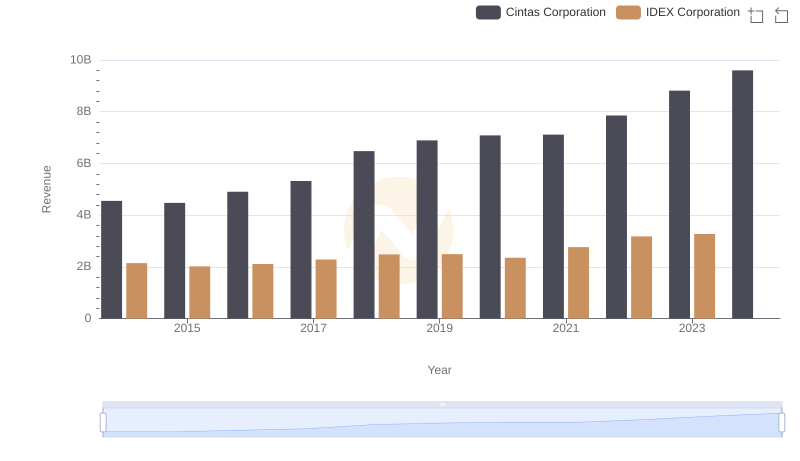
Comparing Revenue Performance: Cintas Corporation or IDEX Corporation?
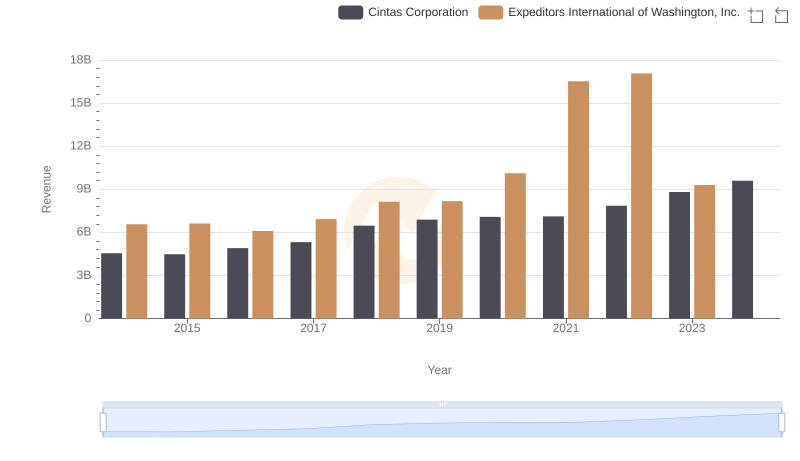
Cintas Corporation or Expeditors International of Washington, Inc.: Who Leads in Yearly Revenue?
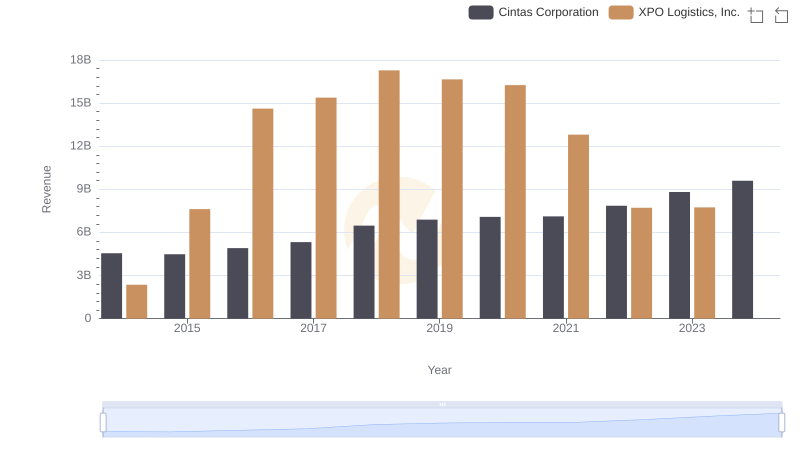
Breaking Down Revenue Trends: Cintas Corporation vs XPO Logistics, Inc.
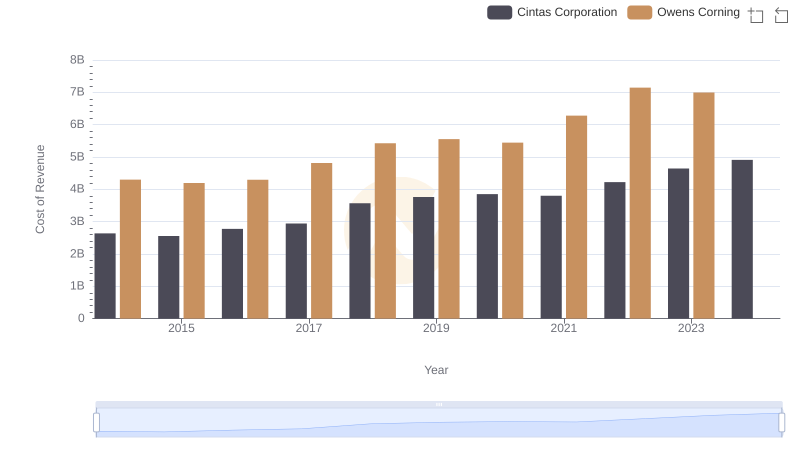
Analyzing Cost of Revenue: Cintas Corporation and Owens Corning
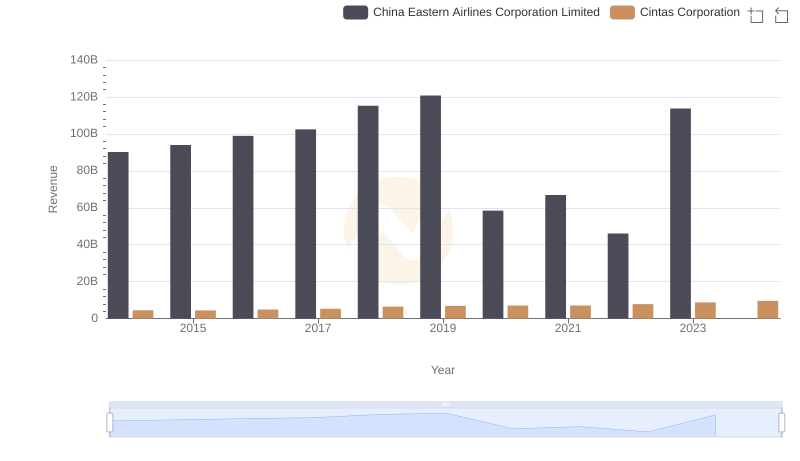
Annual Revenue Comparison: Cintas Corporation vs China Eastern Airlines Corporation Limited
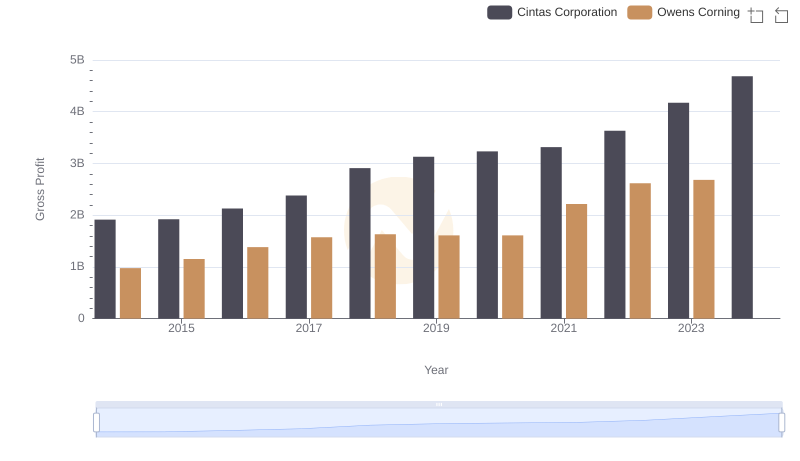
Who Generates Higher Gross Profit? Cintas Corporation or Owens Corning