| __timestamp | AMETEK, Inc. | C.H. Robinson Worldwide, Inc. |
|---|---|---|
| Wednesday, January 1, 2014 | 1424947000 | 1068631000 |
| Thursday, January 1, 2015 | 1425015000 | 1217070000 |
| Friday, January 1, 2016 | 1264867000 | 1212592000 |
| Sunday, January 1, 2017 | 1448739000 | 1188523000 |
| Monday, January 1, 2018 | 1659562000 | 1361693000 |
| Tuesday, January 1, 2019 | 1787660000 | 1287782000 |
| Wednesday, January 1, 2020 | 1543514000 | 1169390000 |
| Friday, January 1, 2021 | 1912614000 | 1608479000 |
| Saturday, January 1, 2022 | 2145269000 | 1870197000 |
| Sunday, January 1, 2023 | 2384465001 | 1138873000 |
| Monday, January 1, 2024 | 6941180000 | 1308765000 |
Cracking the code
In the ever-evolving landscape of American industry, AMETEK, Inc. and C.H. Robinson Worldwide, Inc. have carved distinct paths in their financial journeys. From 2014 to 2023, AMETEK's gross profit surged by approximately 67%, peaking in 2023. This growth reflects AMETEK's strategic innovations and market adaptability. In contrast, C.H. Robinson's gross profit exhibited a more volatile trajectory, with a notable spike in 2024, suggesting potential data anomalies or extraordinary market conditions.
This analysis underscores the dynamic nature of financial performance in the industrial and logistics sectors, offering valuable insights for investors and industry analysts.
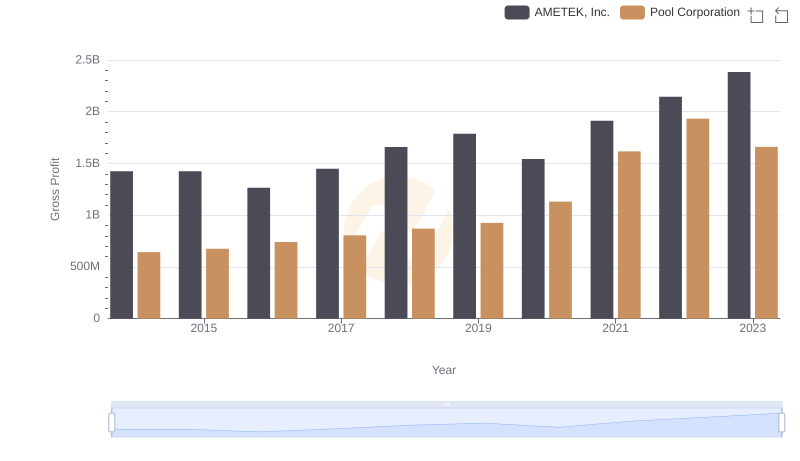
AMETEK, Inc. vs Pool Corporation: A Gross Profit Performance Breakdown
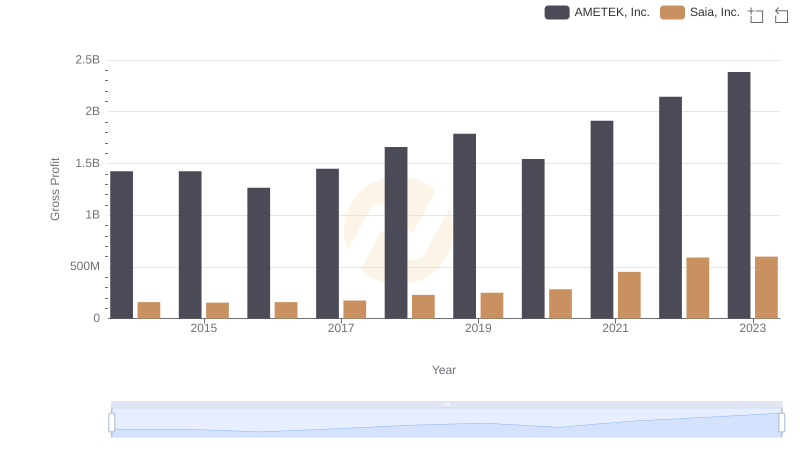
Gross Profit Trends Compared: AMETEK, Inc. vs Saia, Inc.
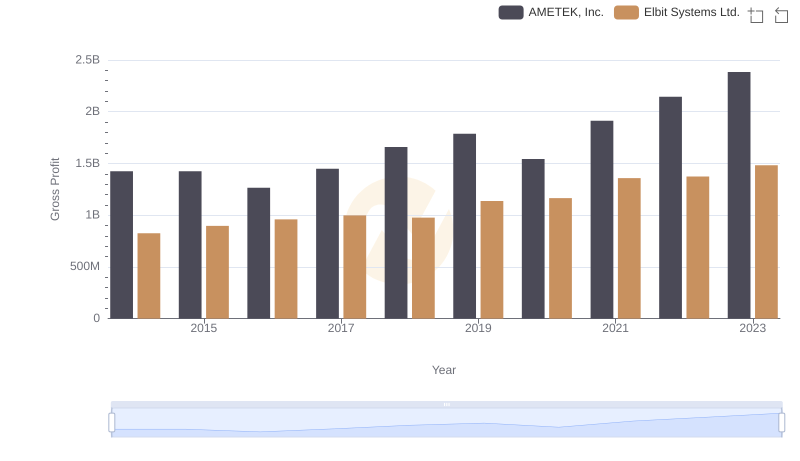
Key Insights on Gross Profit: AMETEK, Inc. vs Elbit Systems Ltd.
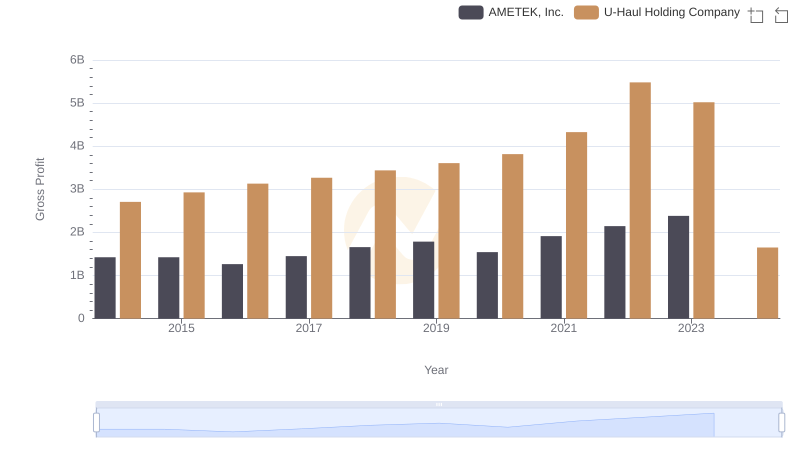
AMETEK, Inc. vs U-Haul Holding Company: A Gross Profit Performance Breakdown
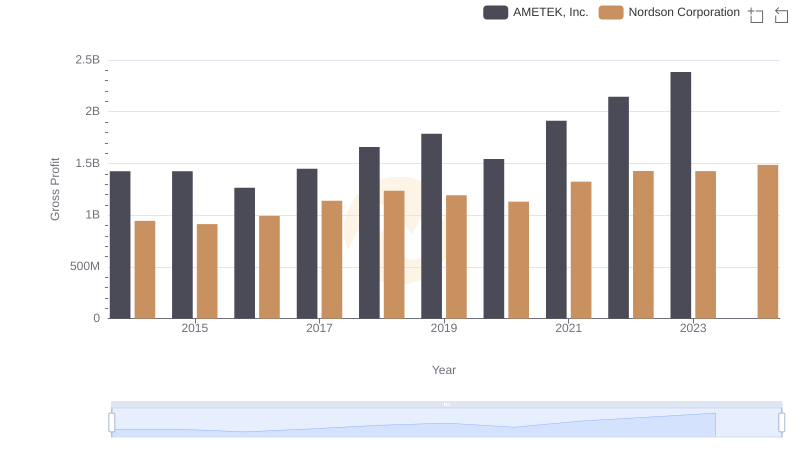
AMETEK, Inc. vs Nordson Corporation: A Gross Profit Performance Breakdown
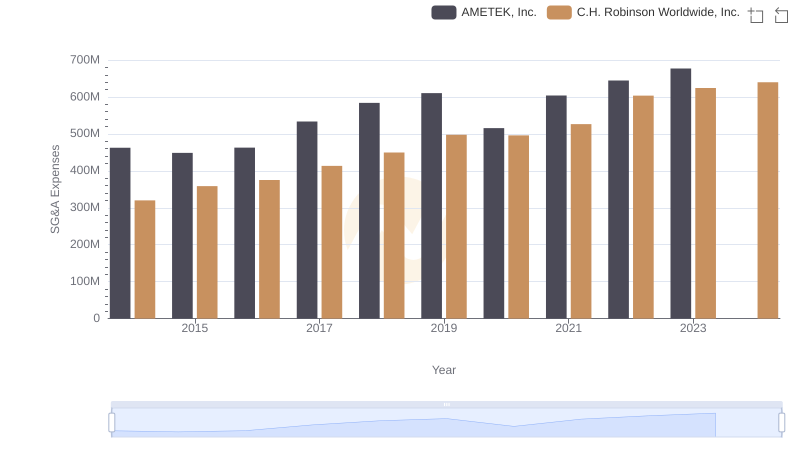
SG&A Efficiency Analysis: Comparing AMETEK, Inc. and C.H. Robinson Worldwide, Inc.
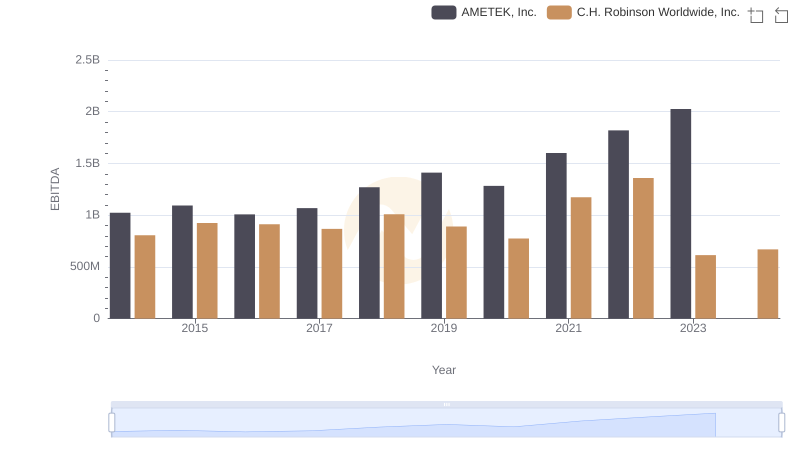
Professional EBITDA Benchmarking: AMETEK, Inc. vs C.H. Robinson Worldwide, Inc.