| __timestamp | AMETEK, Inc. | Masco Corporation |
|---|---|---|
| Wednesday, January 1, 2014 | 4021964000 | 8521000000 |
| Thursday, January 1, 2015 | 3974295000 | 7142000000 |
| Friday, January 1, 2016 | 3840087000 | 7357000000 |
| Sunday, January 1, 2017 | 4300170000 | 7644000000 |
| Monday, January 1, 2018 | 4845872000 | 8359000000 |
| Tuesday, January 1, 2019 | 5158557000 | 6707000000 |
| Wednesday, January 1, 2020 | 4540029000 | 7188000000 |
| Friday, January 1, 2021 | 5546514000 | 8375000000 |
| Saturday, January 1, 2022 | 6150530000 | 8680000000 |
| Sunday, January 1, 2023 | 6596950000 | 7967000000 |
| Monday, January 1, 2024 | 6941180000 | 7828000000 |
Data in motion
In the ever-evolving landscape of industrial and home improvement sectors, AMETEK, Inc. and Masco Corporation have showcased intriguing revenue trajectories from 2014 to 2023. AMETEK, Inc., a leader in electronic instruments and electromechanical devices, has seen a robust growth of approximately 64% over this period. Starting at $4.02 billion in 2014, AMETEK's revenue surged to $6.60 billion by 2023, reflecting a consistent upward trend.
Conversely, Masco Corporation, renowned for its home improvement and building products, experienced a more fluctuating revenue pattern. Despite a peak in 2014 with $8.52 billion, Masco's revenue dipped to $6.71 billion in 2019, before rebounding to $8.68 billion in 2022. However, 2023 saw a slight decline to $7.97 billion, indicating potential market challenges.
These trends highlight the dynamic nature of these industries, with AMETEK's steady growth contrasting Masco's volatility, offering valuable insights for investors and industry analysts alike.
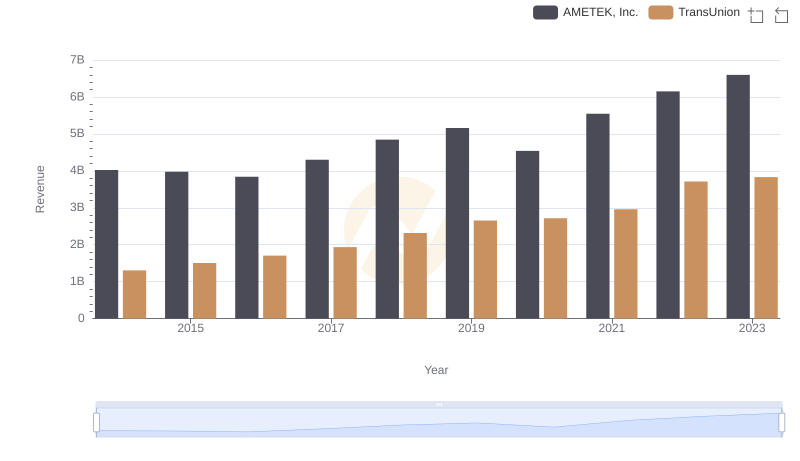
AMETEK, Inc. vs TransUnion: Examining Key Revenue Metrics

AMETEK, Inc. vs Stanley Black & Decker, Inc.: Annual Revenue Growth Compared
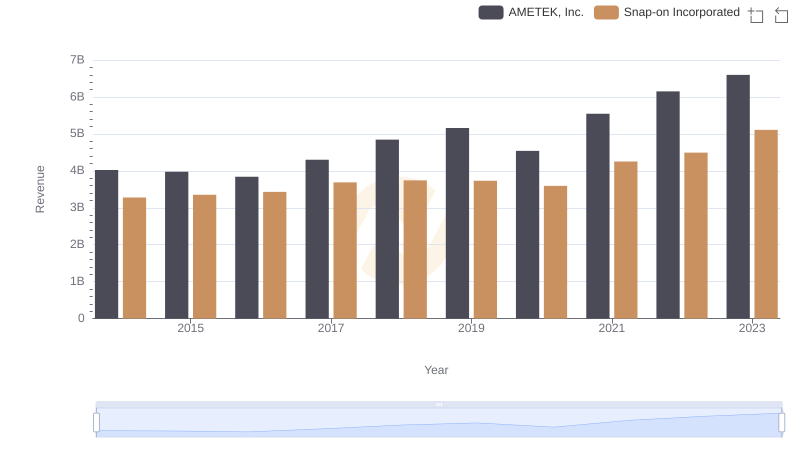
Annual Revenue Comparison: AMETEK, Inc. vs Snap-on Incorporated
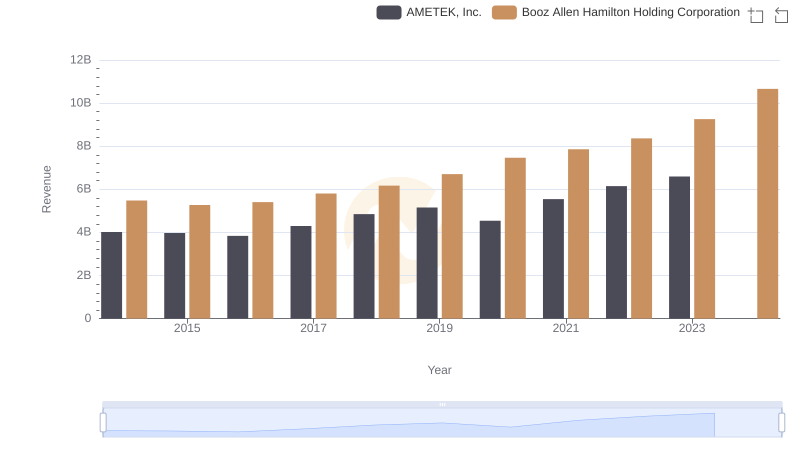
AMETEK, Inc. vs Booz Allen Hamilton Holding Corporation: Examining Key Revenue Metrics
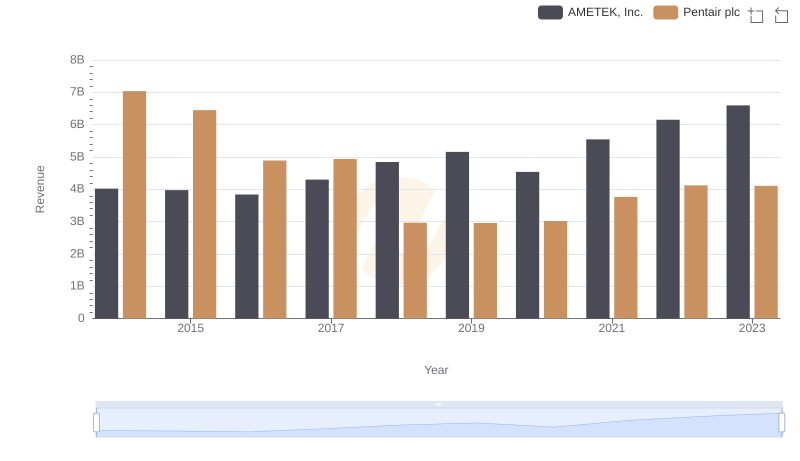
AMETEK, Inc. vs Pentair plc: Annual Revenue Growth Compared
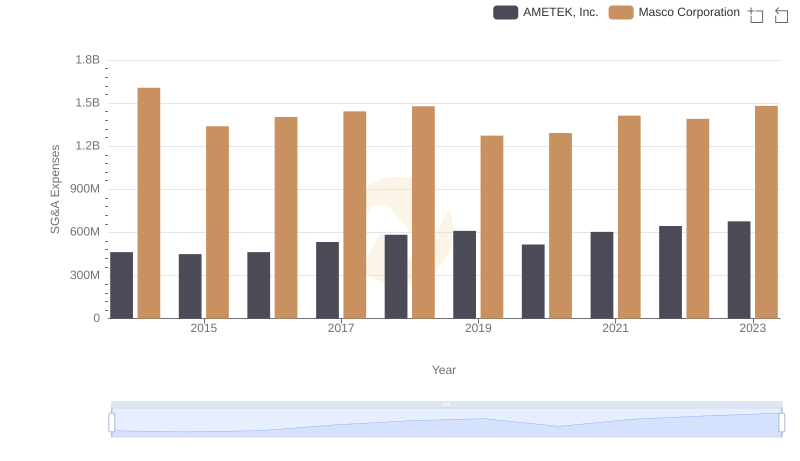
Cost Management Insights: SG&A Expenses for AMETEK, Inc. and Masco Corporation
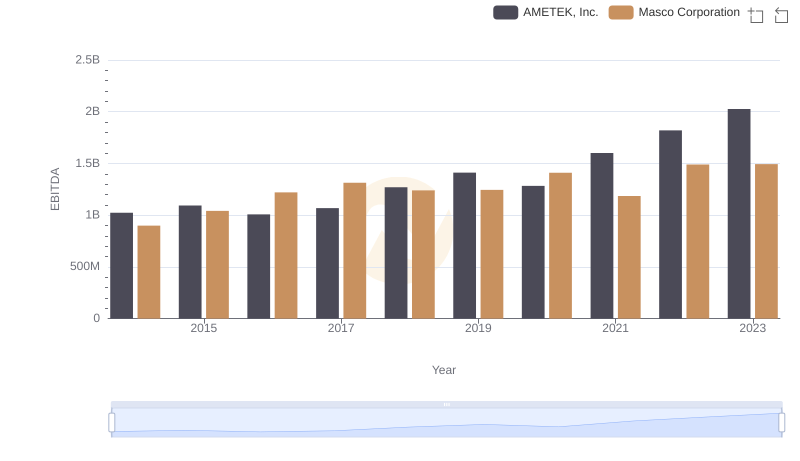
EBITDA Metrics Evaluated: AMETEK, Inc. vs Masco Corporation