| __timestamp | AMETEK, Inc. | Avery Dennison Corporation |
|---|---|---|
| Wednesday, January 1, 2014 | 4021964000 | 6330300000 |
| Thursday, January 1, 2015 | 3974295000 | 5966900000 |
| Friday, January 1, 2016 | 3840087000 | 6086500000 |
| Sunday, January 1, 2017 | 4300170000 | 6613800000 |
| Monday, January 1, 2018 | 4845872000 | 7159000000 |
| Tuesday, January 1, 2019 | 5158557000 | 7070100000 |
| Wednesday, January 1, 2020 | 4540029000 | 6971500000 |
| Friday, January 1, 2021 | 5546514000 | 8408300000 |
| Saturday, January 1, 2022 | 6150530000 | 9039300000 |
| Sunday, January 1, 2023 | 6596950000 | 8364299999 |
| Monday, January 1, 2024 | 6941180000 | 8755700000 |
Unveiling the hidden dimensions of data
In the competitive landscape of industrial manufacturing, AMETEK, Inc. and Avery Dennison Corporation have showcased intriguing revenue trajectories over the past decade. From 2014 to 2023, AMETEK, Inc. experienced a robust growth of approximately 64%, with revenues climbing from $4.02 billion to $6.60 billion. This growth reflects AMETEK's strategic expansions and innovations in electronic instruments and electromechanical devices.
Conversely, Avery Dennison Corporation, a leader in labeling and packaging materials, saw its revenue increase by about 32% during the same period, peaking at $9.04 billion in 2022 before a slight dip to $8.36 billion in 2023. This fluctuation highlights the dynamic nature of the packaging industry, influenced by global supply chain challenges and evolving consumer demands.
These trends underscore the resilience and adaptability of both companies in navigating economic shifts and market demands, offering valuable insights for investors and industry analysts alike.
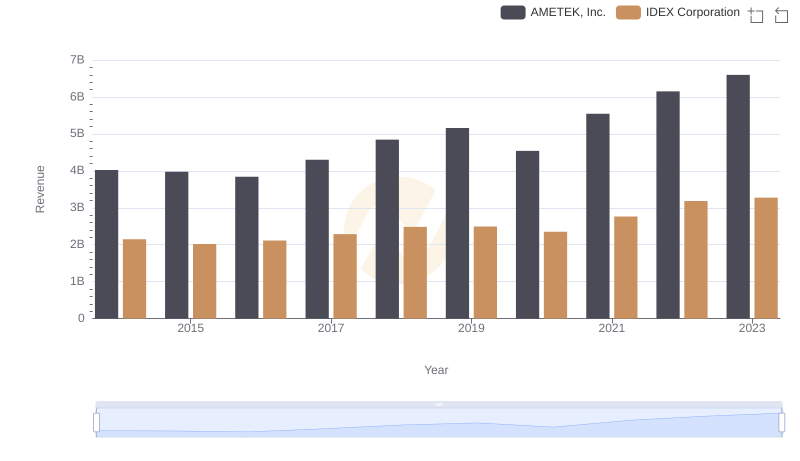
Who Generates More Revenue? AMETEK, Inc. or IDEX Corporation
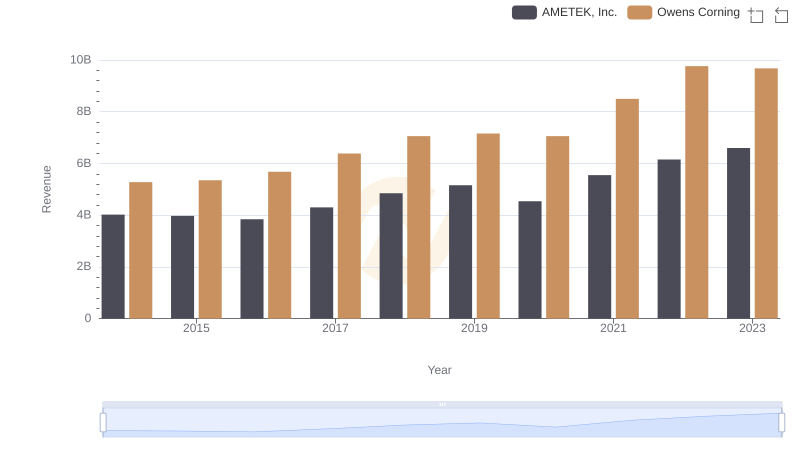
AMETEK, Inc. or Owens Corning: Who Leads in Yearly Revenue?
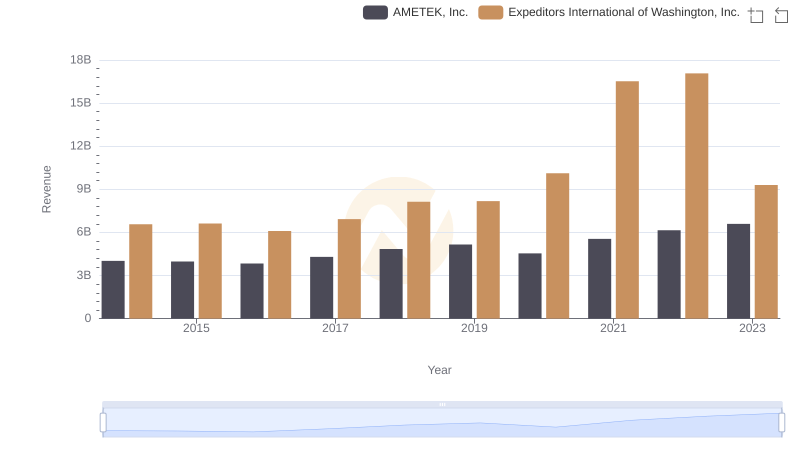
AMETEK, Inc. and Expeditors International of Washington, Inc.: A Comprehensive Revenue Analysis
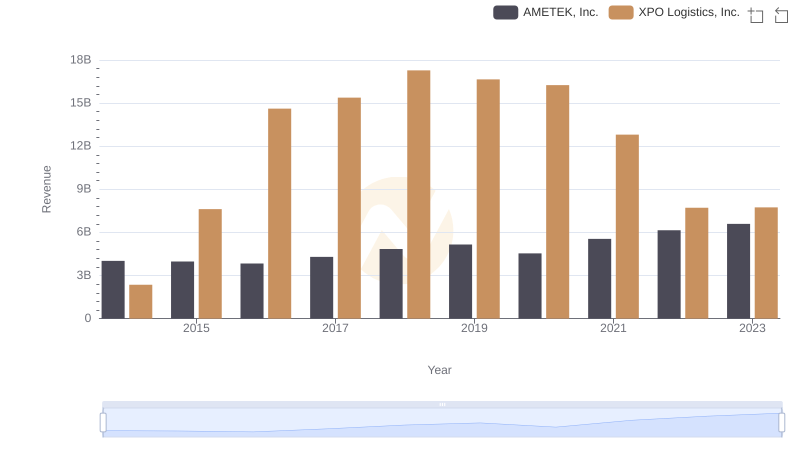
Who Generates More Revenue? AMETEK, Inc. or XPO Logistics, Inc.
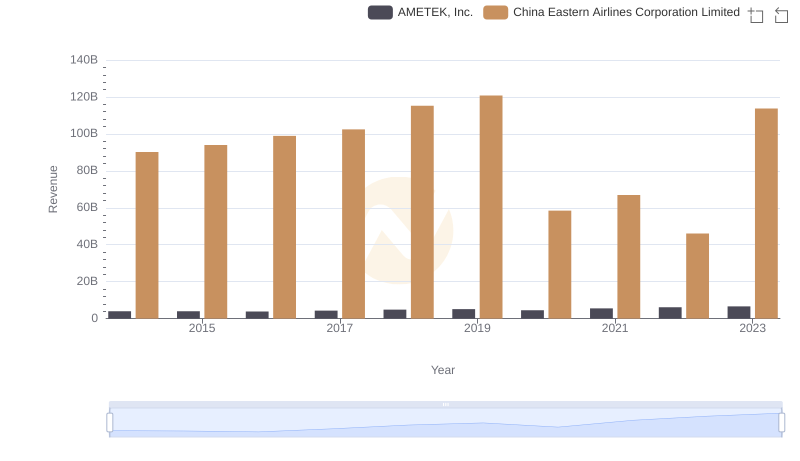
AMETEK, Inc. or China Eastern Airlines Corporation Limited: Who Leads in Yearly Revenue?
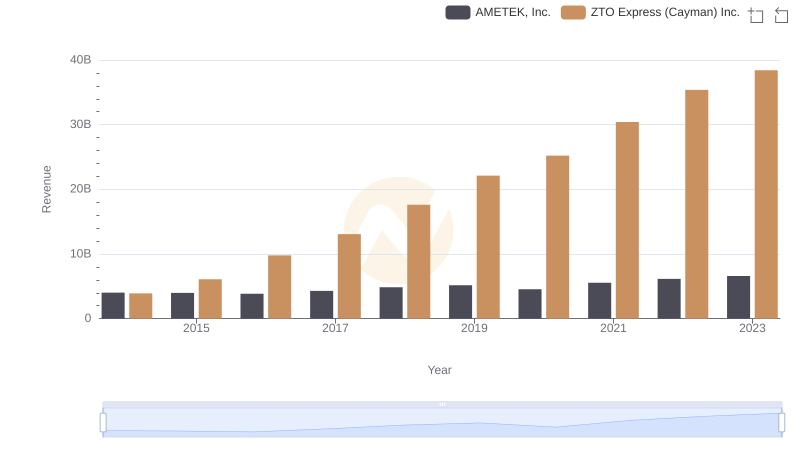
AMETEK, Inc. and ZTO Express (Cayman) Inc.: A Comprehensive Revenue Analysis
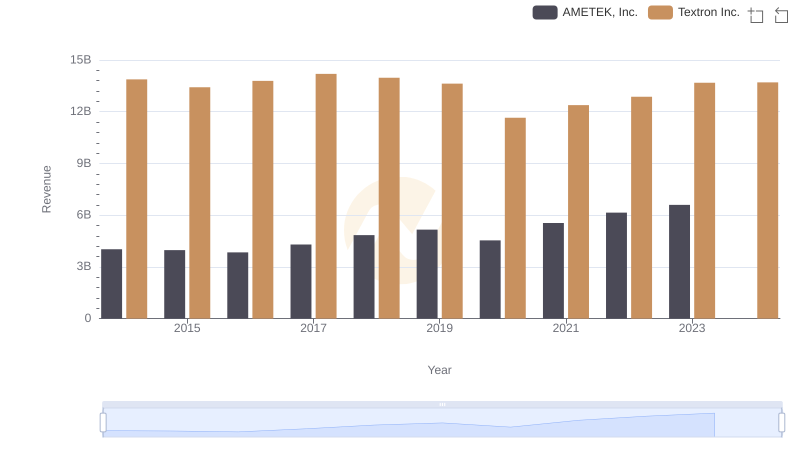
Breaking Down Revenue Trends: AMETEK, Inc. vs Textron Inc.
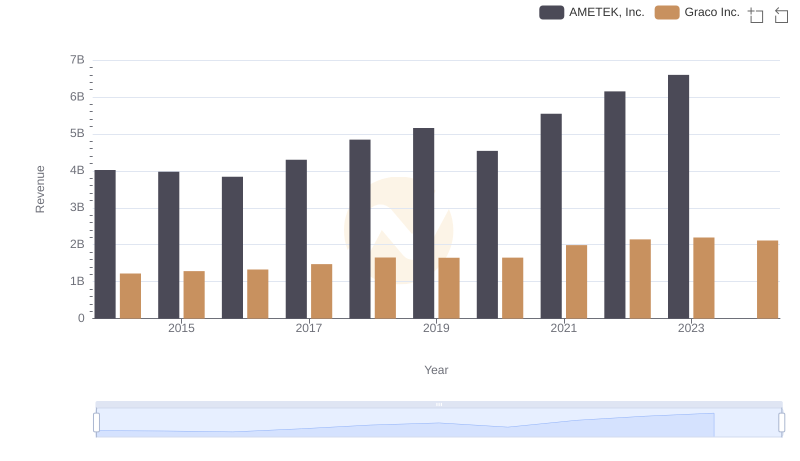
Annual Revenue Comparison: AMETEK, Inc. vs Graco Inc.
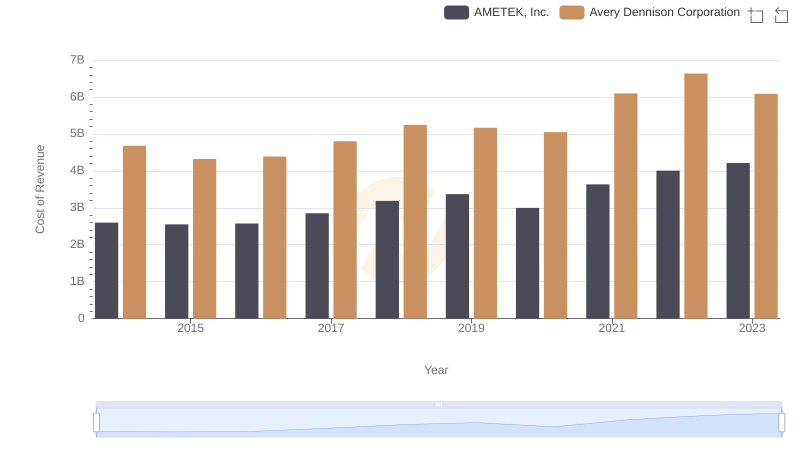
AMETEK, Inc. vs Avery Dennison Corporation: Efficiency in Cost of Revenue Explored
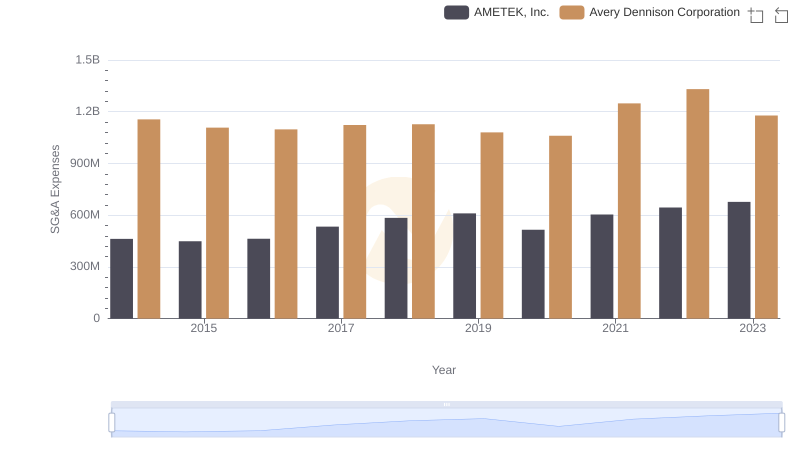
Cost Management Insights: SG&A Expenses for AMETEK, Inc. and Avery Dennison Corporation