| __timestamp | Textron Inc. | Westinghouse Air Brake Technologies Corporation |
|---|---|---|
| Wednesday, January 1, 2014 | 1575000000 | 588370000 |
| Thursday, January 1, 2015 | 1601000000 | 672301000 |
| Friday, January 1, 2016 | 1484000000 | 535893000 |
| Sunday, January 1, 2017 | 1367000000 | 532795000 |
| Monday, January 1, 2018 | 1974000000 | 584199000 |
| Tuesday, January 1, 2019 | 1518000000 | 1067300000 |
| Wednesday, January 1, 2020 | 827000000 | 1229400000 |
| Friday, January 1, 2021 | 1391000000 | 1405000000 |
| Saturday, January 1, 2022 | 1515000000 | 1519000000 |
| Sunday, January 1, 2023 | 1556000000 | 1787000000 |
| Monday, January 1, 2024 | 1422000000 | 1609000000 |
Igniting the spark of knowledge
In the ever-evolving landscape of industrial giants, Westinghouse Air Brake Technologies Corporation and Textron Inc. have showcased intriguing financial trajectories over the past decade. From 2014 to 2023, Textron Inc. consistently demonstrated robust EBITDA figures, peaking in 2018 with a 30% increase from its 2017 performance. However, the pandemic year of 2020 saw a significant dip, with EBITDA dropping by nearly 45% compared to 2019.
Conversely, Westinghouse Air Brake Technologies Corporation exhibited a steady climb, with a remarkable 167% growth in EBITDA from 2014 to 2023. Notably, 2023 marked a milestone as Westinghouse surpassed Textron, achieving an EBITDA of 1.79 billion, a 17% increase from the previous year. This analysis highlights the resilience and strategic maneuvers of these corporations in navigating economic challenges and capitalizing on growth opportunities.
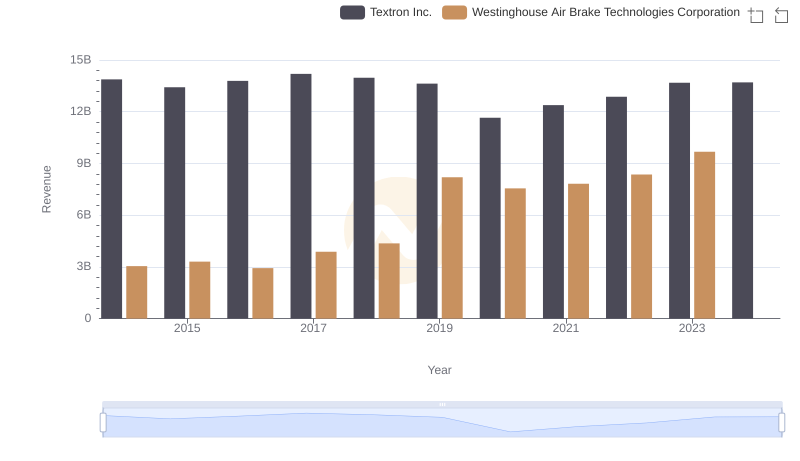
Westinghouse Air Brake Technologies Corporation or Textron Inc.: Who Leads in Yearly Revenue?
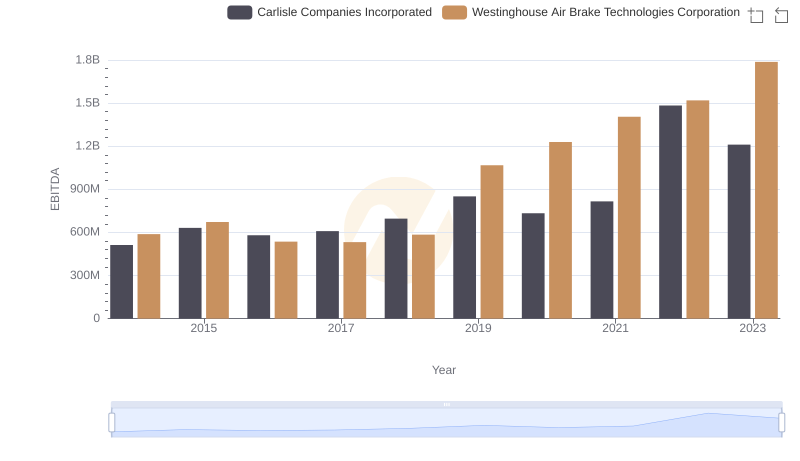
A Side-by-Side Analysis of EBITDA: Westinghouse Air Brake Technologies Corporation and Carlisle Companies Incorporated
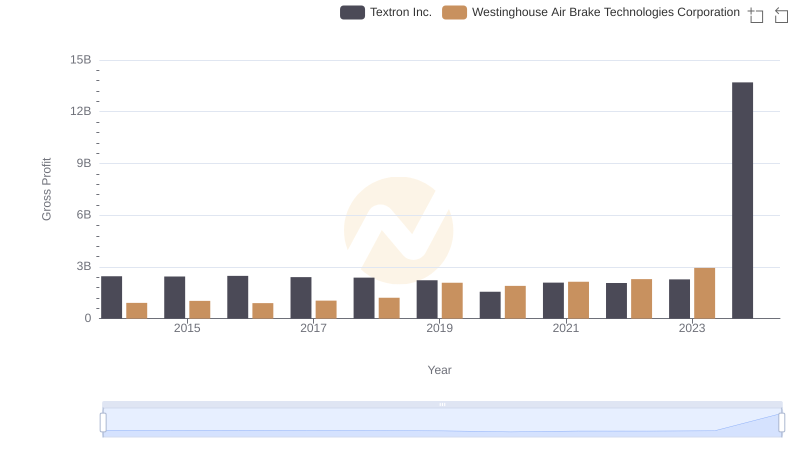
Westinghouse Air Brake Technologies Corporation vs Textron Inc.: A Gross Profit Performance Breakdown
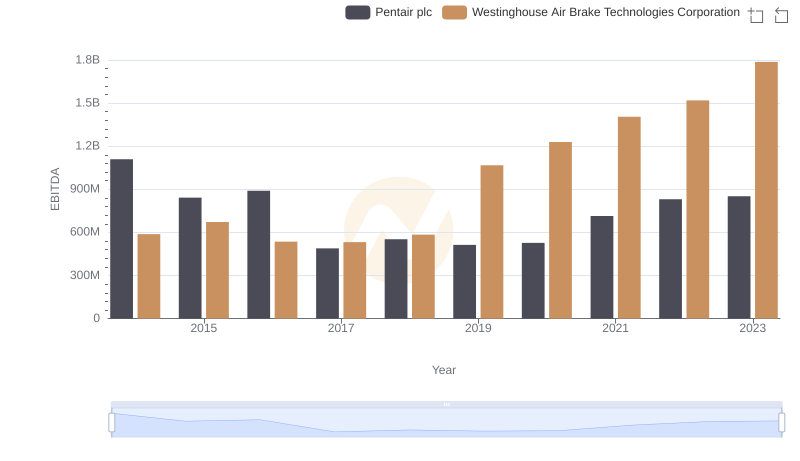
EBITDA Metrics Evaluated: Westinghouse Air Brake Technologies Corporation vs Pentair plc
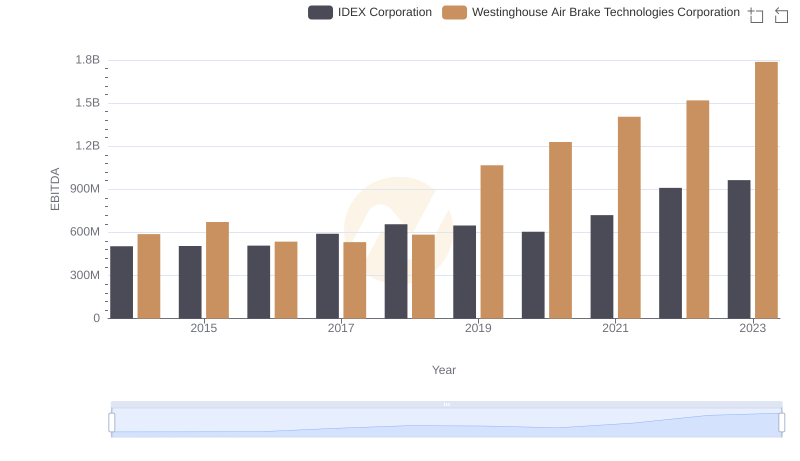
A Professional Review of EBITDA: Westinghouse Air Brake Technologies Corporation Compared to IDEX Corporation
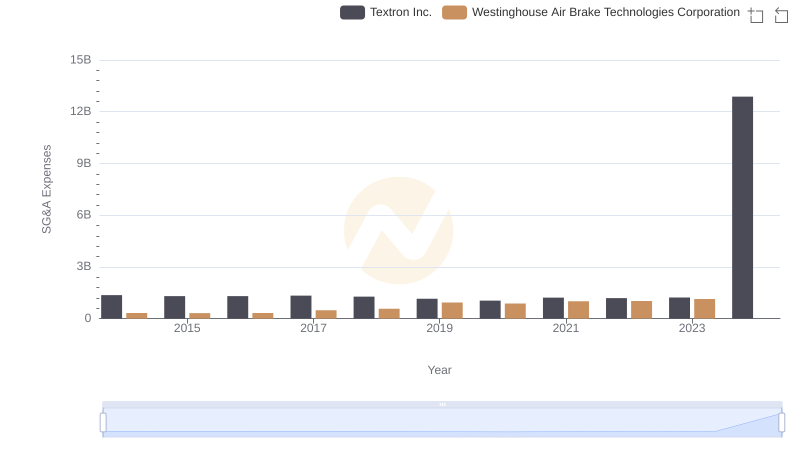
Operational Costs Compared: SG&A Analysis of Westinghouse Air Brake Technologies Corporation and Textron Inc.
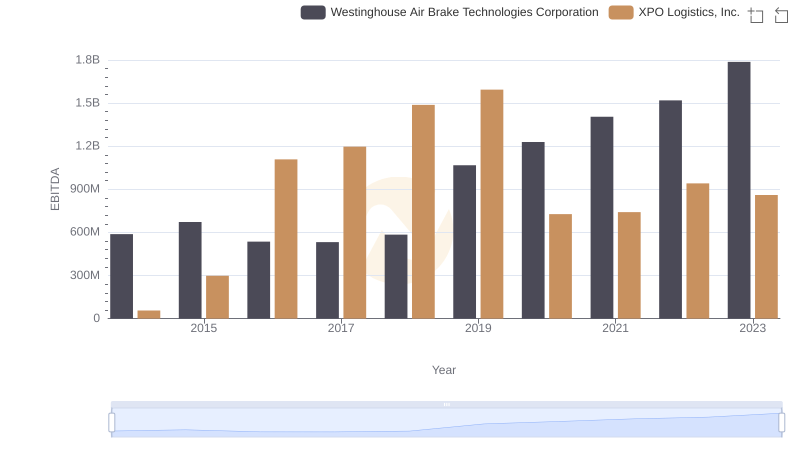
Professional EBITDA Benchmarking: Westinghouse Air Brake Technologies Corporation vs XPO Logistics, Inc.
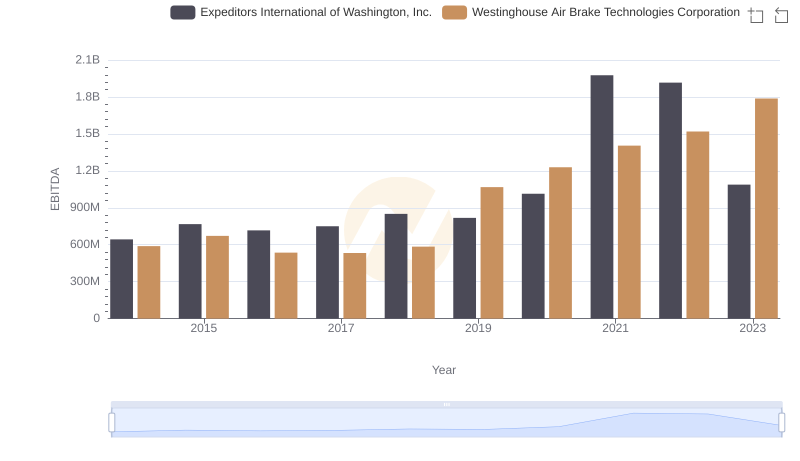
A Professional Review of EBITDA: Westinghouse Air Brake Technologies Corporation Compared to Expeditors International of Washington, Inc.
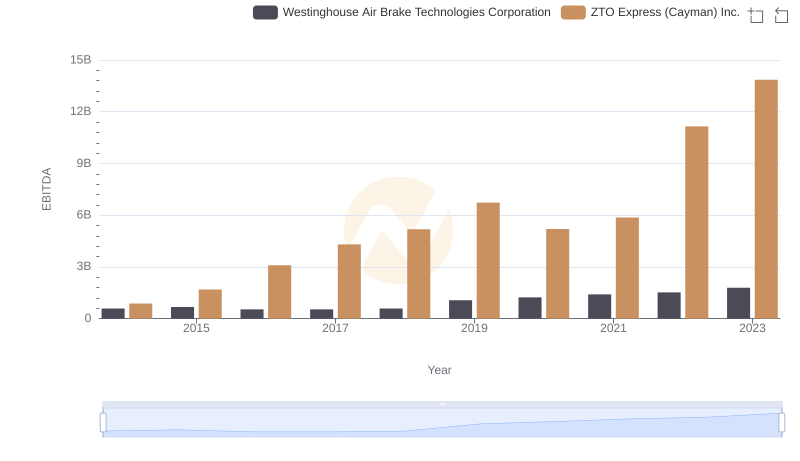
Professional EBITDA Benchmarking: Westinghouse Air Brake Technologies Corporation vs ZTO Express (Cayman) Inc.
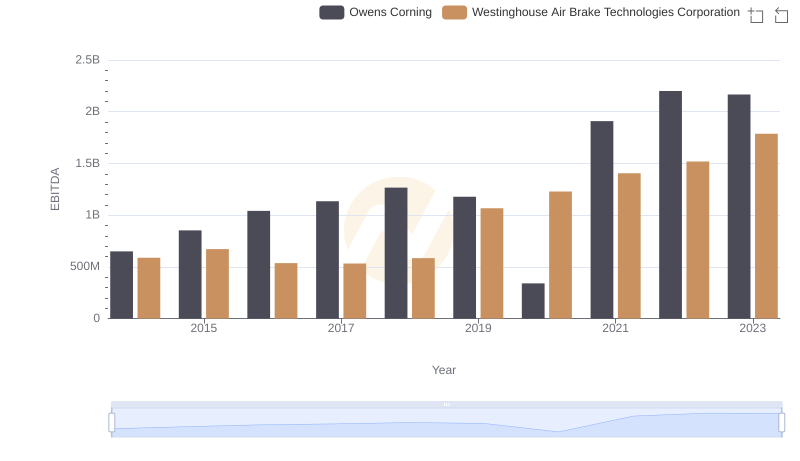
A Side-by-Side Analysis of EBITDA: Westinghouse Air Brake Technologies Corporation and Owens Corning
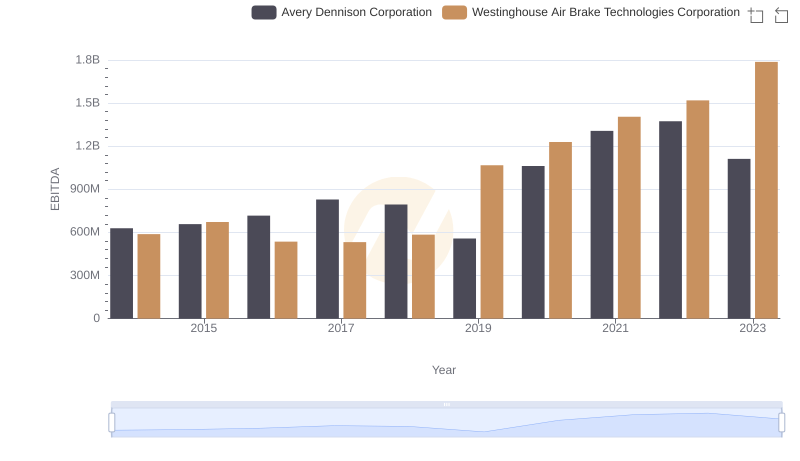
EBITDA Performance Review: Westinghouse Air Brake Technologies Corporation vs Avery Dennison Corporation
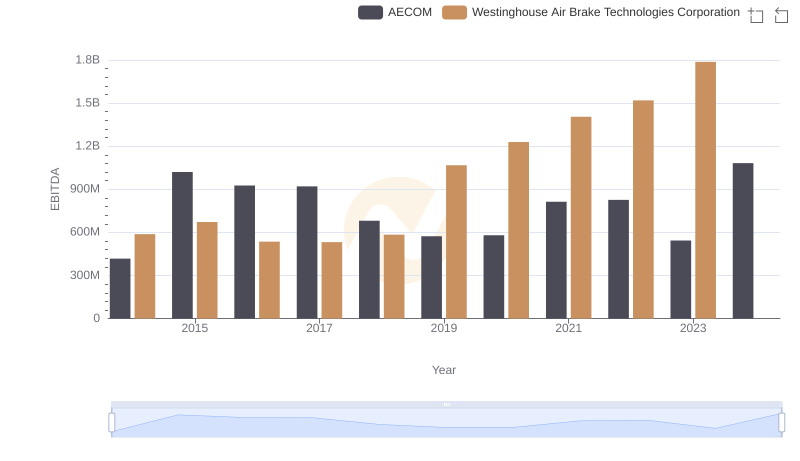
EBITDA Performance Review: Westinghouse Air Brake Technologies Corporation vs AECOM