| __timestamp | Owens Corning | Westinghouse Air Brake Technologies Corporation |
|---|---|---|
| Wednesday, January 1, 2014 | 650000000 | 588370000 |
| Thursday, January 1, 2015 | 853000000 | 672301000 |
| Friday, January 1, 2016 | 1041000000 | 535893000 |
| Sunday, January 1, 2017 | 1134000000 | 532795000 |
| Monday, January 1, 2018 | 1266000000 | 584199000 |
| Tuesday, January 1, 2019 | 1178000000 | 1067300000 |
| Wednesday, January 1, 2020 | 341000000 | 1229400000 |
| Friday, January 1, 2021 | 1909000000 | 1405000000 |
| Saturday, January 1, 2022 | 2200000000 | 1519000000 |
| Sunday, January 1, 2023 | 2166000000 | 1787000000 |
| Monday, January 1, 2024 | 1609000000 |
Unleashing insights
In the ever-evolving landscape of industrial giants, Westinghouse Air Brake Technologies Corporation and Owens Corning have showcased remarkable financial trajectories over the past decade. From 2014 to 2023, Owens Corning's EBITDA surged by an impressive 233%, reflecting its robust market strategies and operational efficiencies. Meanwhile, Westinghouse Air Brake Technologies Corporation demonstrated a commendable 204% growth in the same period, underscoring its resilience and adaptability in a competitive market.
These trends not only reflect the companies' financial health but also their strategic foresight in navigating market challenges.
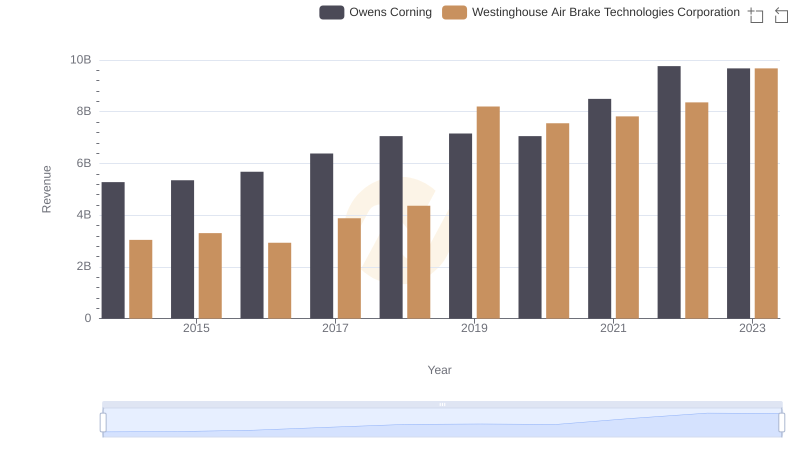
Annual Revenue Comparison: Westinghouse Air Brake Technologies Corporation vs Owens Corning
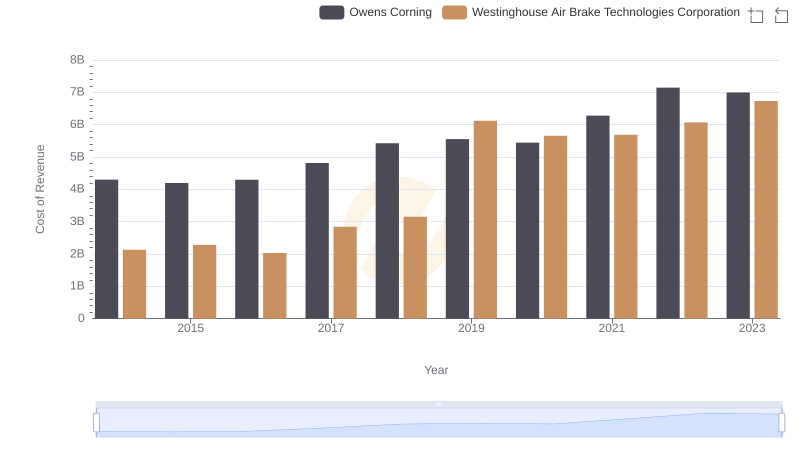
Westinghouse Air Brake Technologies Corporation vs Owens Corning: Efficiency in Cost of Revenue Explored
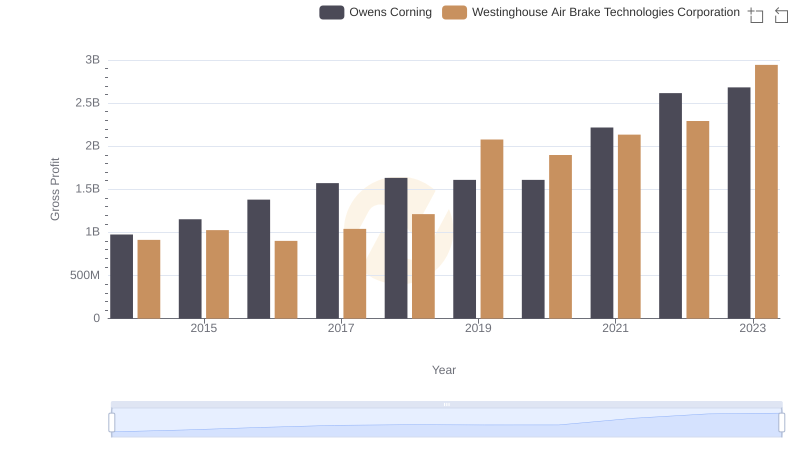
Gross Profit Analysis: Comparing Westinghouse Air Brake Technologies Corporation and Owens Corning
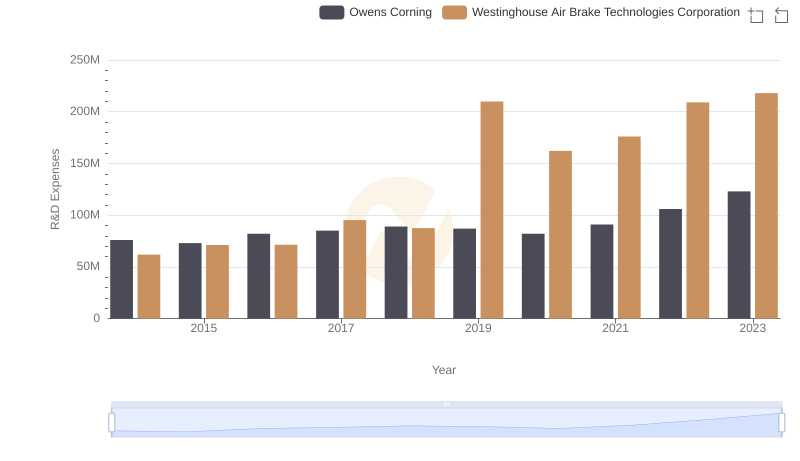
Westinghouse Air Brake Technologies Corporation vs Owens Corning: Strategic Focus on R&D Spending
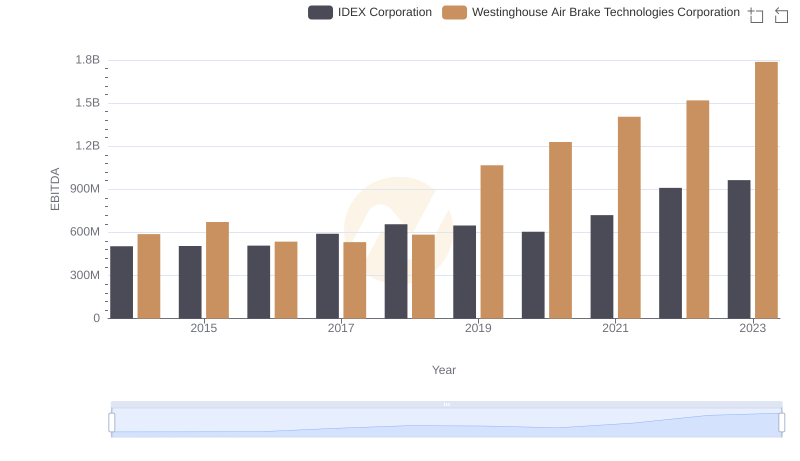
A Professional Review of EBITDA: Westinghouse Air Brake Technologies Corporation Compared to IDEX Corporation
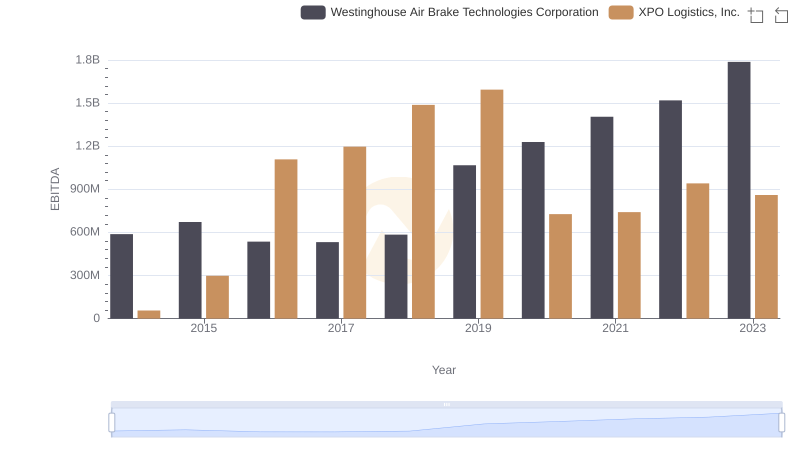
Professional EBITDA Benchmarking: Westinghouse Air Brake Technologies Corporation vs XPO Logistics, Inc.
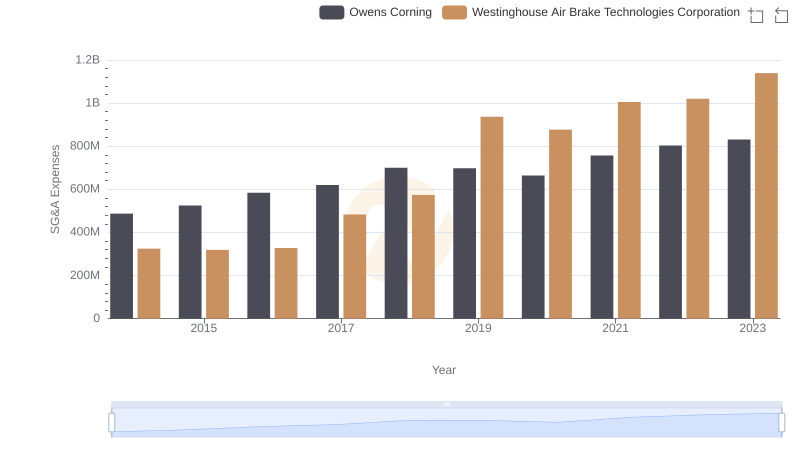
Who Optimizes SG&A Costs Better? Westinghouse Air Brake Technologies Corporation or Owens Corning
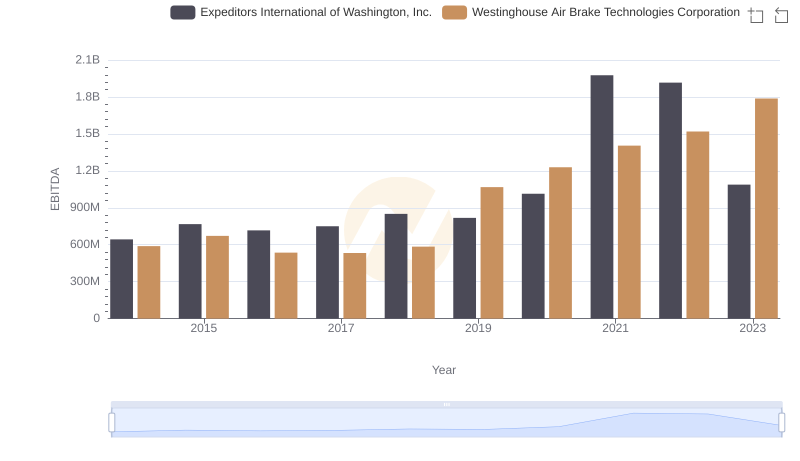
A Professional Review of EBITDA: Westinghouse Air Brake Technologies Corporation Compared to Expeditors International of Washington, Inc.
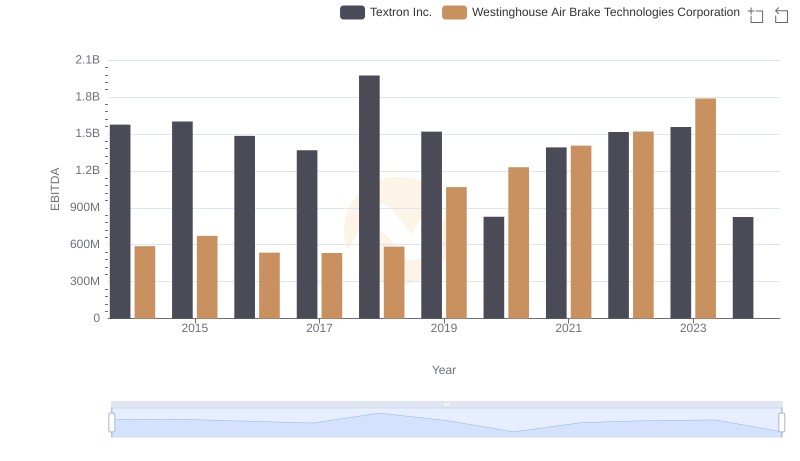
A Side-by-Side Analysis of EBITDA: Westinghouse Air Brake Technologies Corporation and Textron Inc.
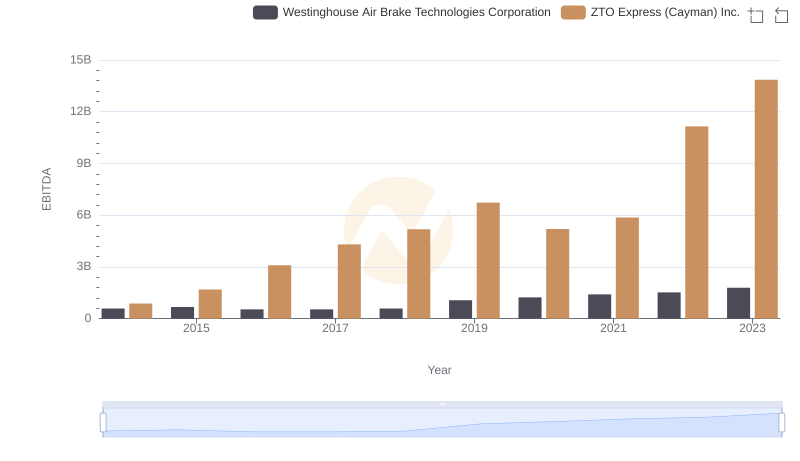
Professional EBITDA Benchmarking: Westinghouse Air Brake Technologies Corporation vs ZTO Express (Cayman) Inc.
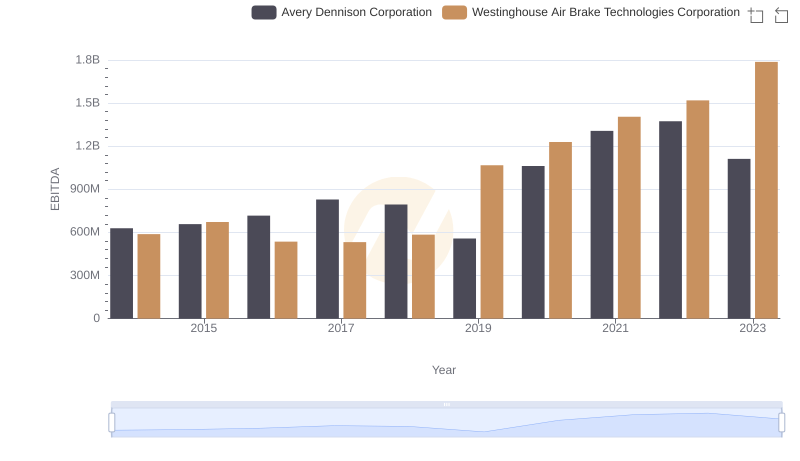
EBITDA Performance Review: Westinghouse Air Brake Technologies Corporation vs Avery Dennison Corporation
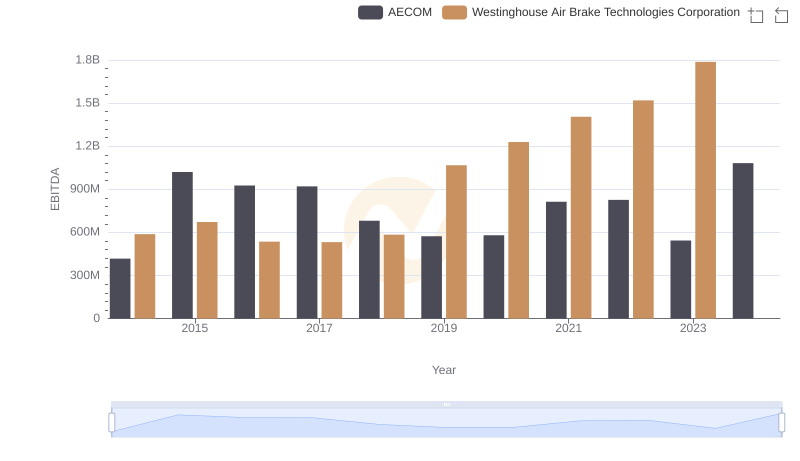
EBITDA Performance Review: Westinghouse Air Brake Technologies Corporation vs AECOM