| __timestamp | Textron Inc. | Westinghouse Air Brake Technologies Corporation |
|---|---|---|
| Wednesday, January 1, 2014 | 2457000000 | 913534000 |
| Thursday, January 1, 2015 | 2444000000 | 1026153000 |
| Friday, January 1, 2016 | 2477000000 | 901541000 |
| Sunday, January 1, 2017 | 2403000000 | 1040597000 |
| Monday, January 1, 2018 | 2378000000 | 1211731000 |
| Tuesday, January 1, 2019 | 2224000000 | 2077600000 |
| Wednesday, January 1, 2020 | 1557000000 | 1898700000 |
| Friday, January 1, 2021 | 2085000000 | 2135000000 |
| Saturday, January 1, 2022 | 2069000000 | 2292000000 |
| Sunday, January 1, 2023 | 2278000000 | 2944000000 |
| Monday, January 1, 2024 | 2502000000 | 3366000000 |
Data in motion
In the competitive landscape of industrial manufacturing, Westinghouse Air Brake Technologies Corporation and Textron Inc. have showcased intriguing gross profit trajectories over the past decade. From 2014 to 2023, Textron Inc. experienced a steady gross profit, peaking in 2024 with a remarkable 500% increase compared to its 2020 figures. Meanwhile, Westinghouse Air Brake Technologies Corporation demonstrated a robust growth pattern, culminating in a 225% rise in 2023 compared to its 2014 performance.
This analysis highlights the dynamic shifts in the industrial sector, emphasizing the resilience and strategic prowess of these two industry leaders.
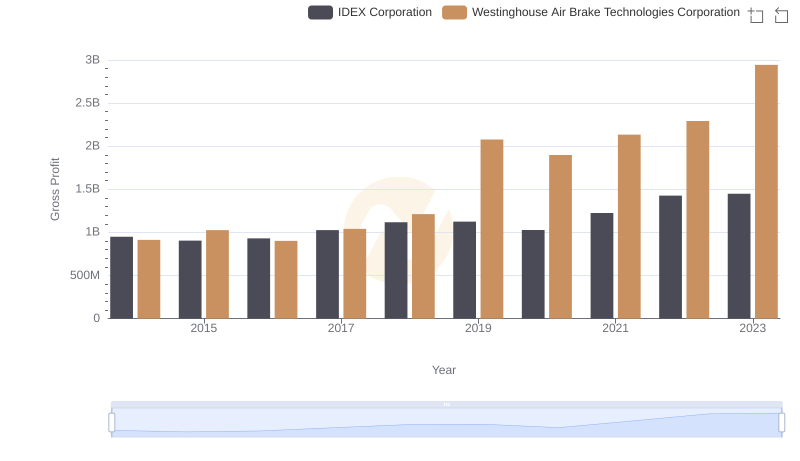
Key Insights on Gross Profit: Westinghouse Air Brake Technologies Corporation vs IDEX Corporation
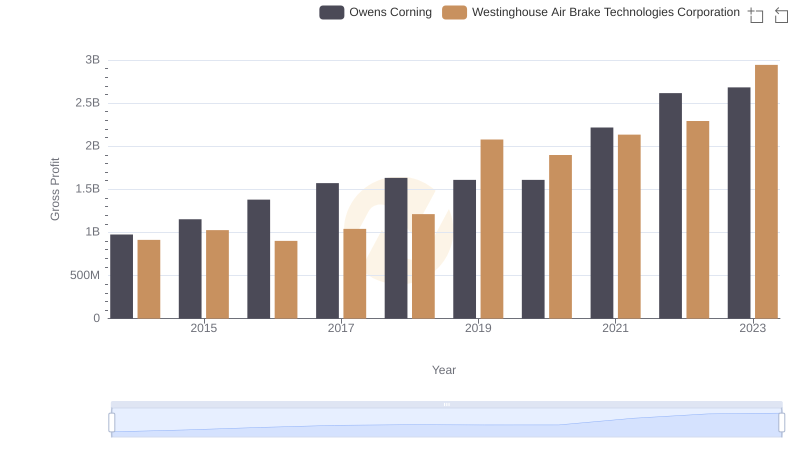
Gross Profit Analysis: Comparing Westinghouse Air Brake Technologies Corporation and Owens Corning
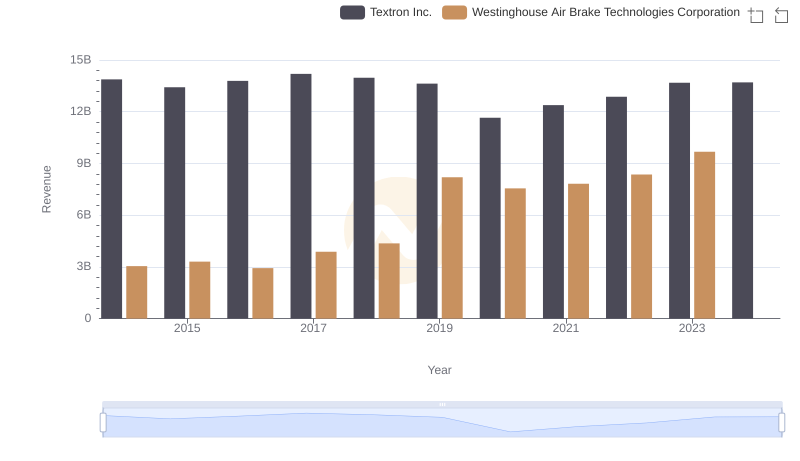
Westinghouse Air Brake Technologies Corporation or Textron Inc.: Who Leads in Yearly Revenue?
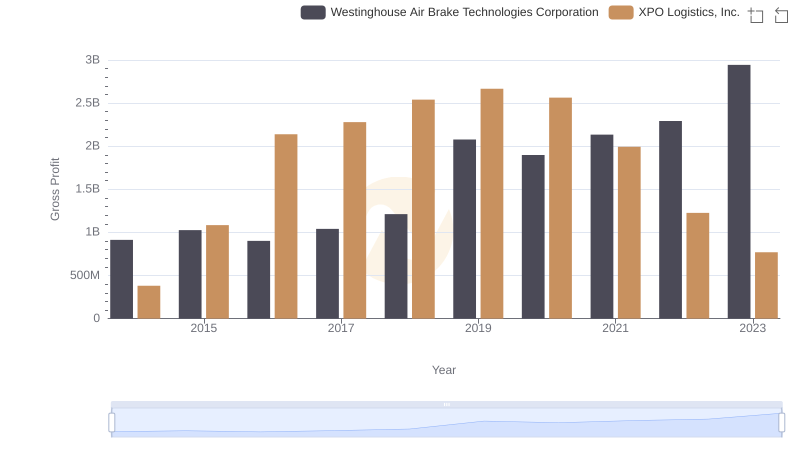
Who Generates Higher Gross Profit? Westinghouse Air Brake Technologies Corporation or XPO Logistics, Inc.
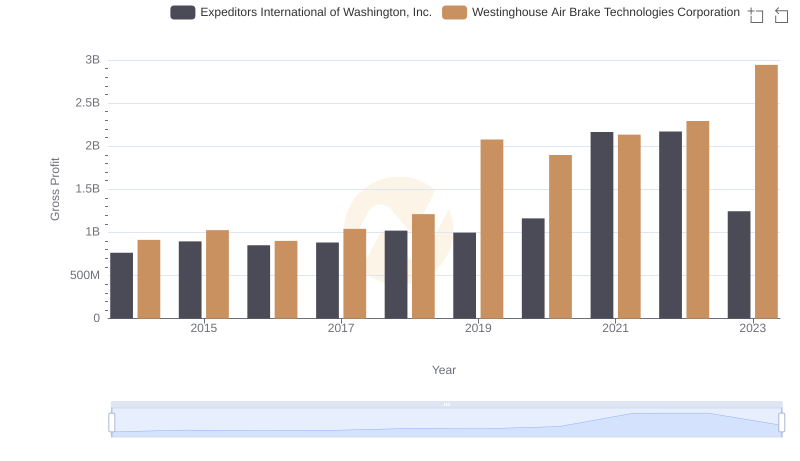
Westinghouse Air Brake Technologies Corporation vs Expeditors International of Washington, Inc.: A Gross Profit Performance Breakdown
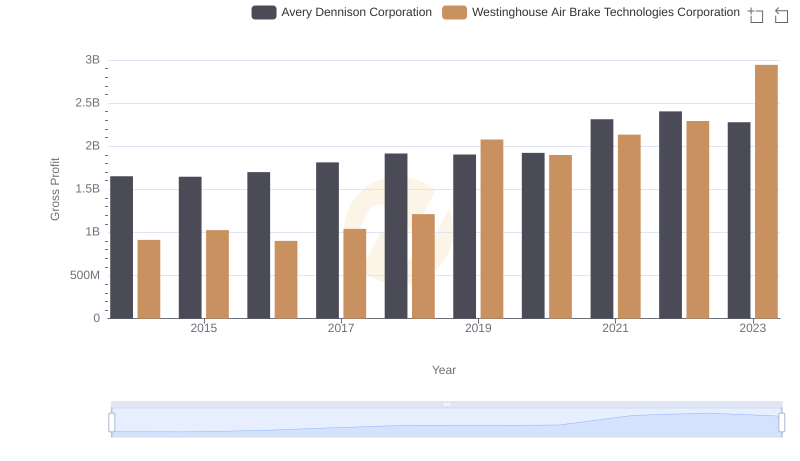
Gross Profit Trends Compared: Westinghouse Air Brake Technologies Corporation vs Avery Dennison Corporation
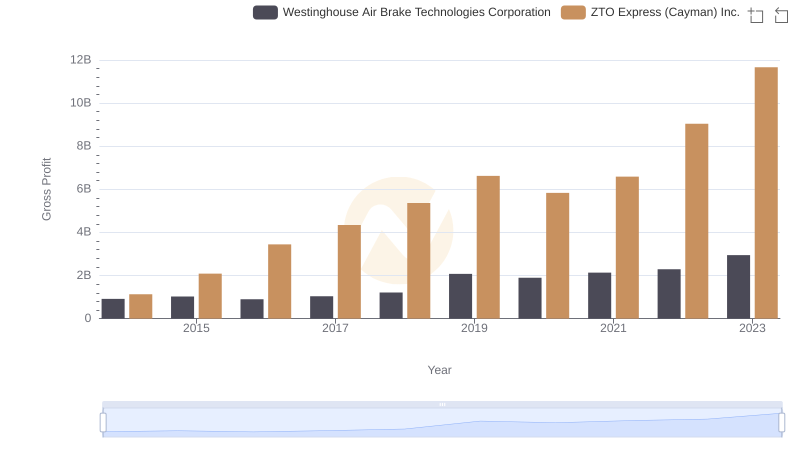
Westinghouse Air Brake Technologies Corporation and ZTO Express (Cayman) Inc.: A Detailed Gross Profit Analysis
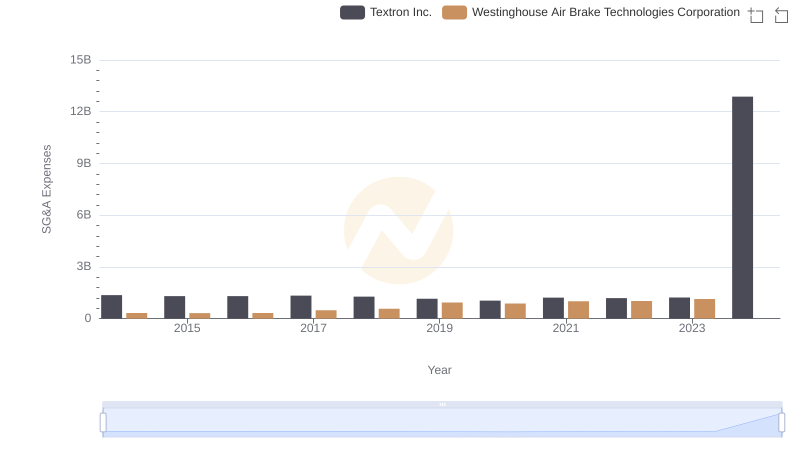
Operational Costs Compared: SG&A Analysis of Westinghouse Air Brake Technologies Corporation and Textron Inc.
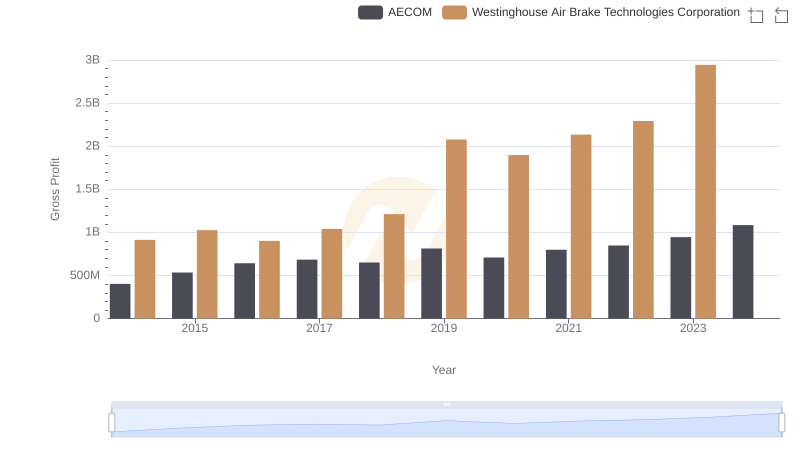
Gross Profit Comparison: Westinghouse Air Brake Technologies Corporation and AECOM Trends
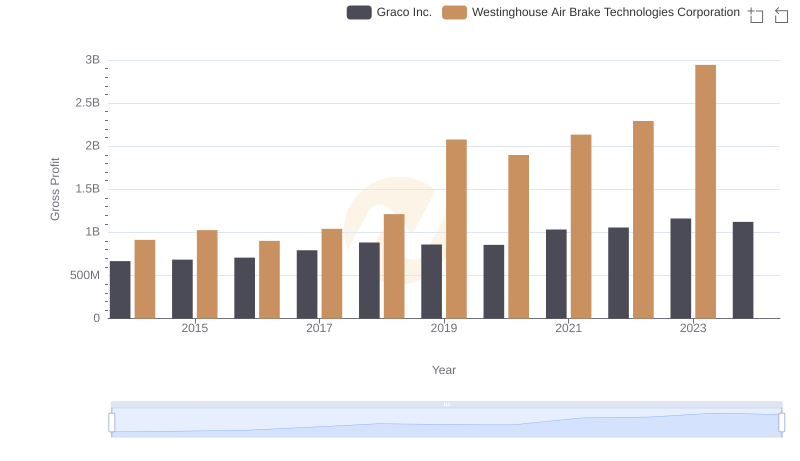
Who Generates Higher Gross Profit? Westinghouse Air Brake Technologies Corporation or Graco Inc.
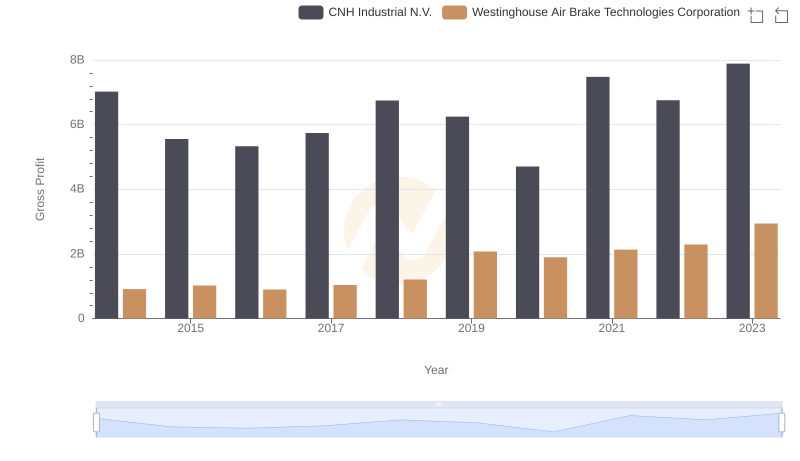
Gross Profit Comparison: Westinghouse Air Brake Technologies Corporation and CNH Industrial N.V. Trends
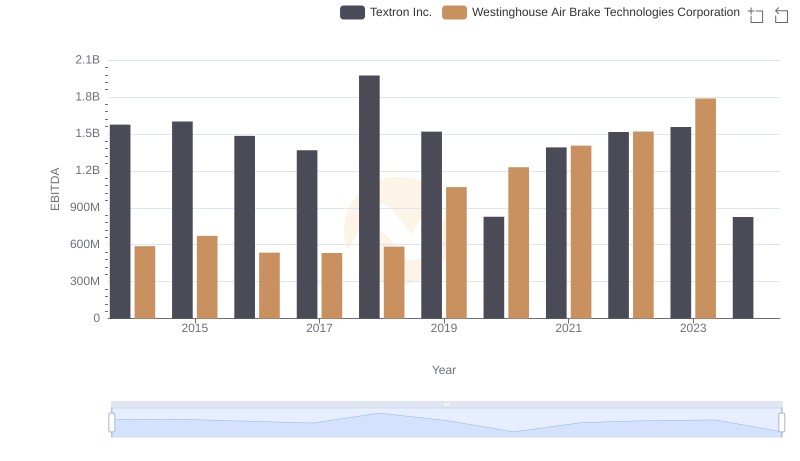
A Side-by-Side Analysis of EBITDA: Westinghouse Air Brake Technologies Corporation and Textron Inc.