| __timestamp | Owens Corning | Westinghouse Air Brake Technologies Corporation |
|---|---|---|
| Wednesday, January 1, 2014 | 5276000000 | 3044454000 |
| Thursday, January 1, 2015 | 5350000000 | 3307998000 |
| Friday, January 1, 2016 | 5677000000 | 2931188000 |
| Sunday, January 1, 2017 | 6384000000 | 3881756000 |
| Monday, January 1, 2018 | 7057000000 | 4363547000 |
| Tuesday, January 1, 2019 | 7160000000 | 8200000000 |
| Wednesday, January 1, 2020 | 7055000000 | 7556100000 |
| Friday, January 1, 2021 | 8498000000 | 7822000000 |
| Saturday, January 1, 2022 | 9761000000 | 8362000000 |
| Sunday, January 1, 2023 | 9677000000 | 9677000000 |
| Monday, January 1, 2024 | 10387000000 |
Unlocking the unknown
In the ever-evolving landscape of industrial and building materials, Westinghouse Air Brake Technologies Corporation and Owens Corning have emerged as formidable players. Over the past decade, from 2014 to 2023, these companies have demonstrated remarkable revenue growth, reflecting their resilience and adaptability in a competitive market.
Owens Corning, a leader in insulation and roofing, has seen its revenue soar by approximately 83%, from $5.3 billion in 2014 to a peak of $9.8 billion in 2022. Meanwhile, Westinghouse Air Brake Technologies Corporation, a key player in the rail industry, has experienced a staggering 218% increase, with revenues climbing from $3 billion in 2014 to match Owens Corning's $9.7 billion in 2023.
This comparison highlights the dynamic nature of these industries and underscores the strategic maneuvers that have propelled these companies to new heights.
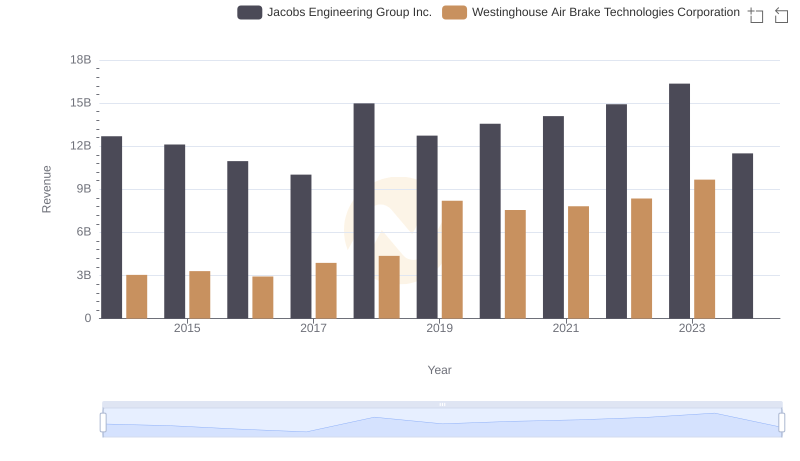
Who Generates More Revenue? Westinghouse Air Brake Technologies Corporation or Jacobs Engineering Group Inc.
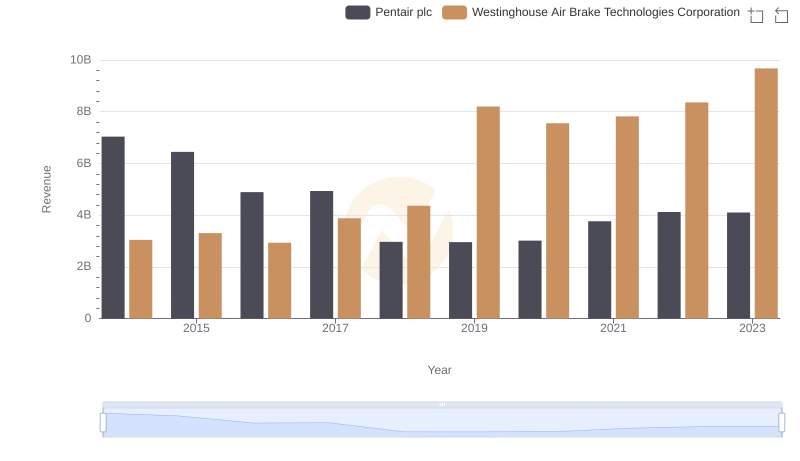
Revenue Showdown: Westinghouse Air Brake Technologies Corporation vs Pentair plc
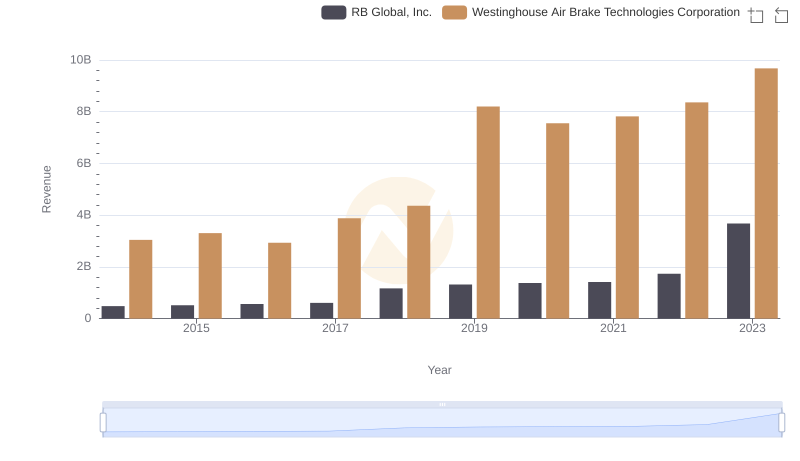
Annual Revenue Comparison: Westinghouse Air Brake Technologies Corporation vs RB Global, Inc.
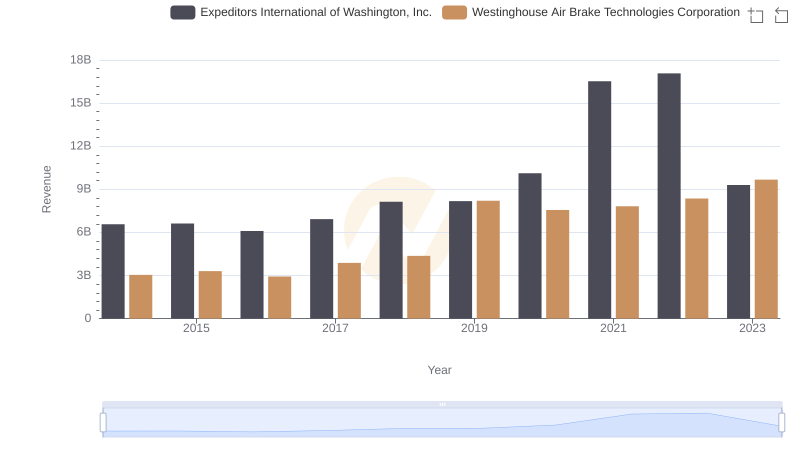
Comparing Revenue Performance: Westinghouse Air Brake Technologies Corporation or Expeditors International of Washington, Inc.?
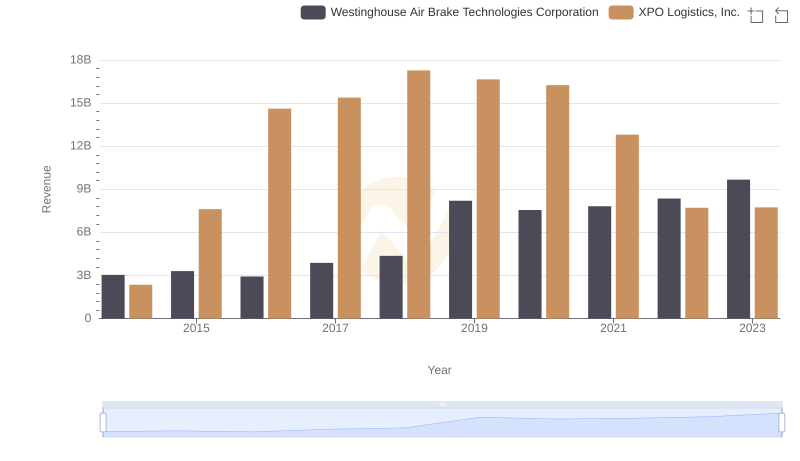
Comparing Revenue Performance: Westinghouse Air Brake Technologies Corporation or XPO Logistics, Inc.?
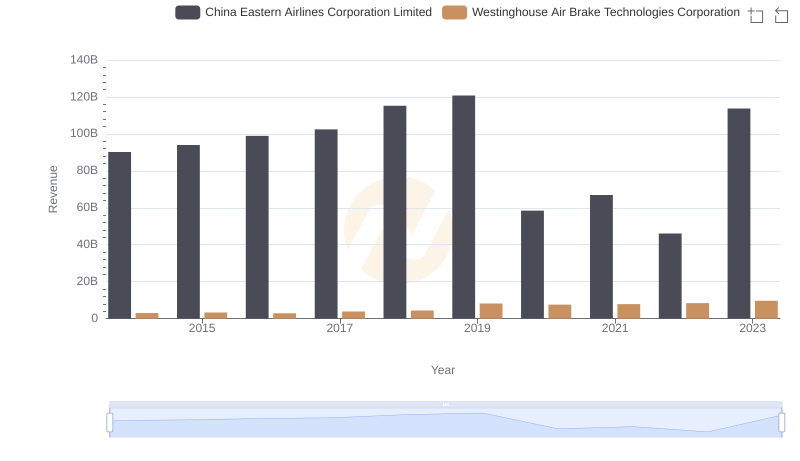
Revenue Insights: Westinghouse Air Brake Technologies Corporation and China Eastern Airlines Corporation Limited Performance Compared
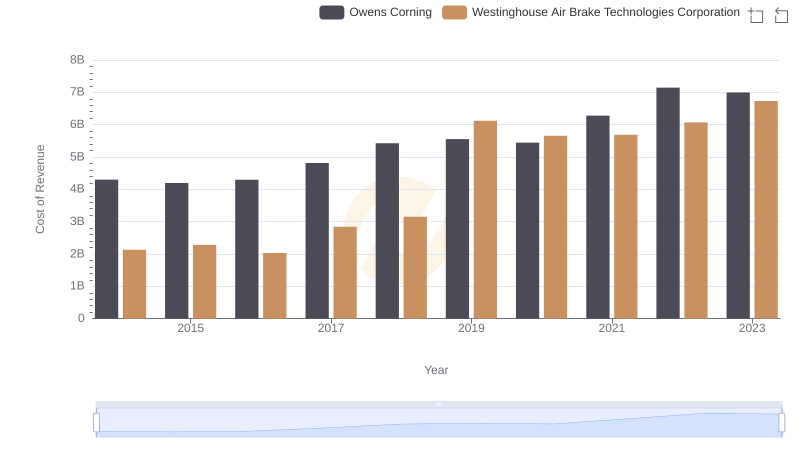
Westinghouse Air Brake Technologies Corporation vs Owens Corning: Efficiency in Cost of Revenue Explored
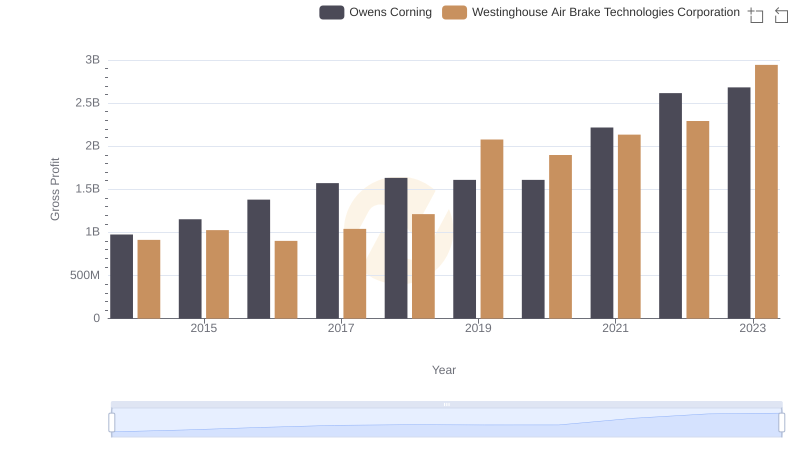
Gross Profit Analysis: Comparing Westinghouse Air Brake Technologies Corporation and Owens Corning
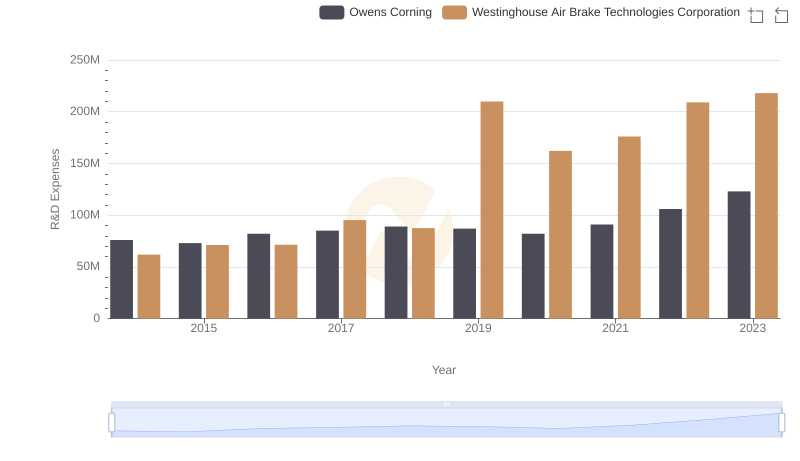
Westinghouse Air Brake Technologies Corporation vs Owens Corning: Strategic Focus on R&D Spending
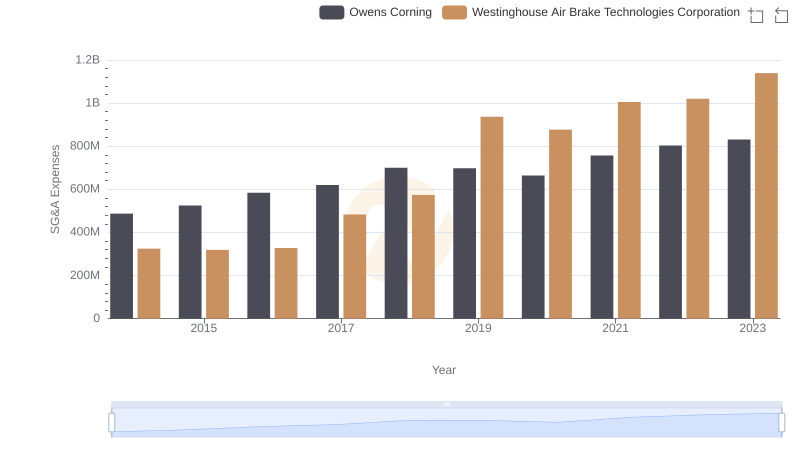
Who Optimizes SG&A Costs Better? Westinghouse Air Brake Technologies Corporation or Owens Corning
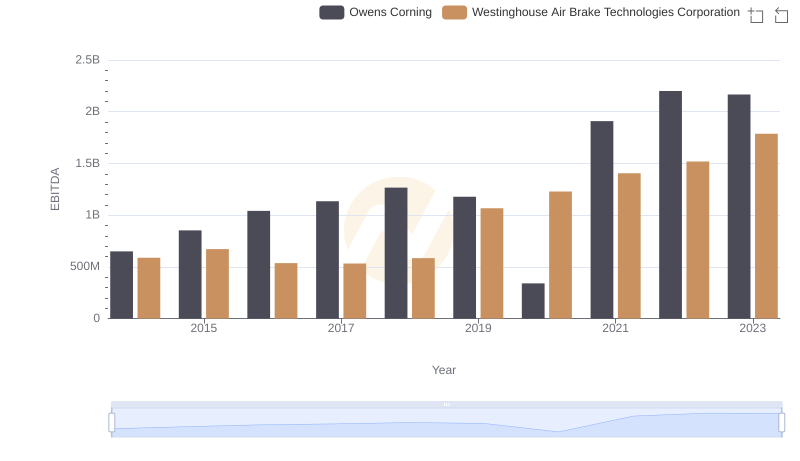
A Side-by-Side Analysis of EBITDA: Westinghouse Air Brake Technologies Corporation and Owens Corning