| __timestamp | Thomson Reuters Corporation | Union Pacific Corporation |
|---|---|---|
| Wednesday, January 1, 2014 | 4289000000 | 10808000000 |
| Thursday, January 1, 2015 | 3151000000 | 10290000000 |
| Friday, January 1, 2016 | 2999000000 | 9502000000 |
| Sunday, January 1, 2017 | 1495930891 | 10456000000 |
| Monday, January 1, 2018 | 1345686008 | 10802000000 |
| Tuesday, January 1, 2019 | 1913474675 | 11013000000 |
| Wednesday, January 1, 2020 | 2757000000 | 10331000000 |
| Friday, January 1, 2021 | 1994296441 | 11843000000 |
| Saturday, January 1, 2022 | 3010000000 | 12636000000 |
| Sunday, January 1, 2023 | 2950000000 | 11928000000 |
| Monday, January 1, 2024 | 12461000000 |
Unveiling the hidden dimensions of data
In the world of corporate finance, EBITDA serves as a crucial indicator of a company's operational profitability. This comparison between Union Pacific Corporation and Thomson Reuters Corporation from 2014 to 2023 reveals intriguing insights. Union Pacific, a titan in the transportation sector, consistently outperformed Thomson Reuters, a leader in information services, with EBITDA figures often more than three times higher. Notably, Union Pacific's EBITDA peaked in 2022, showcasing a robust 20% increase from 2014. Meanwhile, Thomson Reuters experienced a significant dip in 2017, with EBITDA dropping by over 65% compared to 2014, before recovering in subsequent years. The data highlights Union Pacific's steady growth trajectory, while Thomson Reuters faced more volatility. As we look to 2024, Union Pacific's continued upward trend is evident, though Thomson Reuters' data remains elusive, leaving room for speculation.
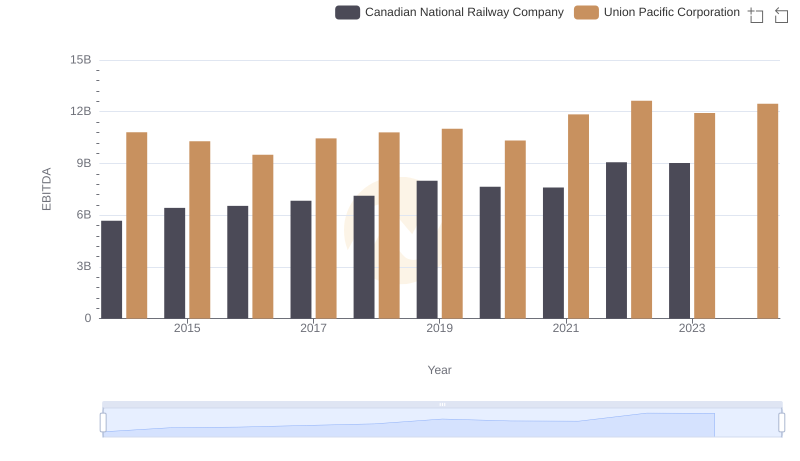
EBITDA Metrics Evaluated: Union Pacific Corporation vs Canadian National Railway Company
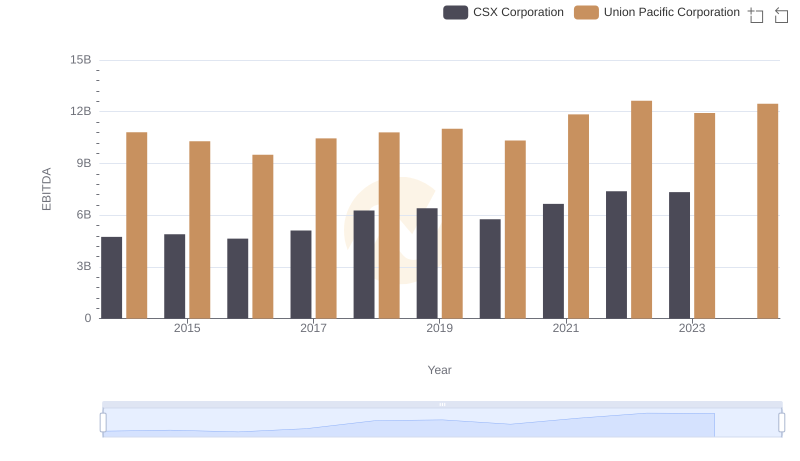
A Side-by-Side Analysis of EBITDA: Union Pacific Corporation and CSX Corporation
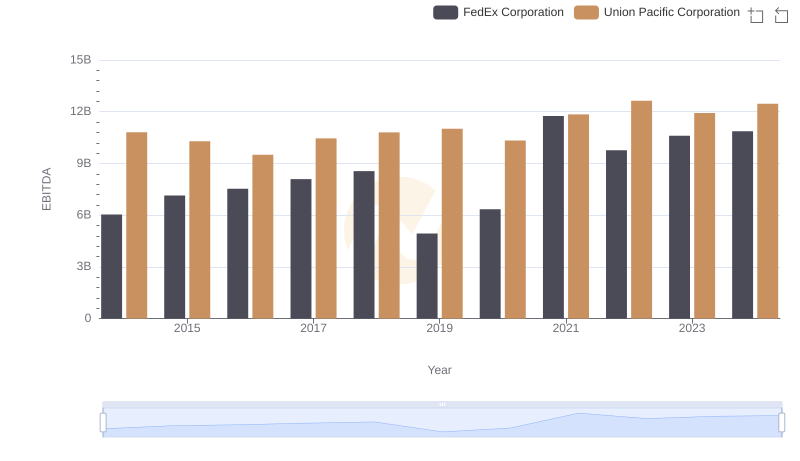
A Professional Review of EBITDA: Union Pacific Corporation Compared to FedEx Corporation
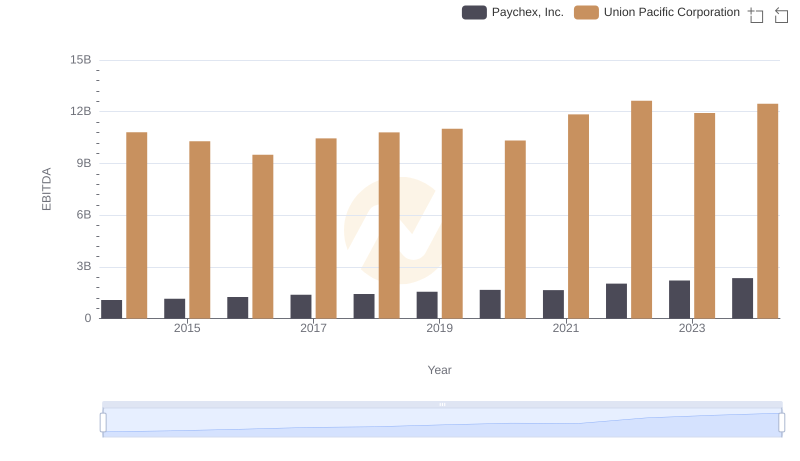
Union Pacific Corporation vs Paychex, Inc.: In-Depth EBITDA Performance Comparison