| __timestamp | Allegion plc | Old Dominion Freight Line, Inc. |
|---|---|---|
| Wednesday, January 1, 2014 | 1264600000 | 2100409000 |
| Thursday, January 1, 2015 | 1199000000 | 2214943000 |
| Friday, January 1, 2016 | 1252700000 | 2246890000 |
| Sunday, January 1, 2017 | 1337500000 | 2482732000 |
| Monday, January 1, 2018 | 1558400000 | 2899452000 |
| Tuesday, January 1, 2019 | 1601700000 | 2938895000 |
| Wednesday, January 1, 2020 | 1541100000 | 2786531000 |
| Friday, January 1, 2021 | 1662500000 | 3481268000 |
| Saturday, January 1, 2022 | 1949500000 | 4003951000 |
| Sunday, January 1, 2023 | 2069300000 | 3793953000 |
| Monday, January 1, 2024 | 2103700000 |
Unleashing the power of data
In the competitive landscape of logistics and security solutions, Old Dominion Freight Line, Inc. and Allegion plc stand as titans. From 2014 to 2023, Old Dominion's cost of revenue surged by approximately 80%, reflecting its robust expansion and operational efficiency. In contrast, Allegion plc experienced a 64% increase, showcasing its steady growth in the security sector. Notably, Old Dominion consistently outpaced Allegion, with its cost of revenue peaking at nearly double that of Allegion in 2022. This trend underscores Old Dominion's aggressive market strategy and scale. As we delve into these figures, it's evident that while both companies have grown, their paths and strategies diverge significantly. This analysis offers a window into the strategic priorities and market dynamics shaping these industry leaders.
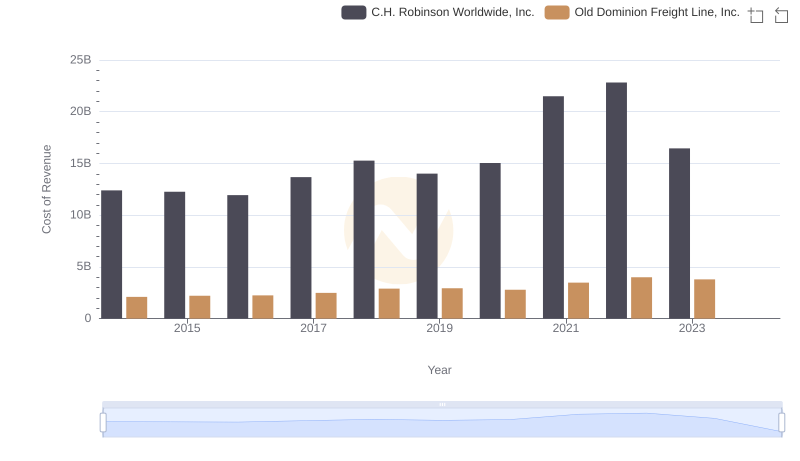
Comparing Cost of Revenue Efficiency: Old Dominion Freight Line, Inc. vs C.H. Robinson Worldwide, Inc.
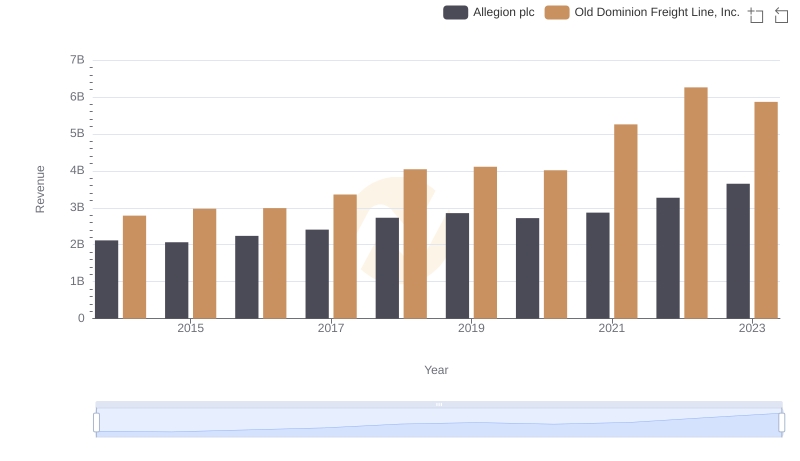
Revenue Insights: Old Dominion Freight Line, Inc. and Allegion plc Performance Compared
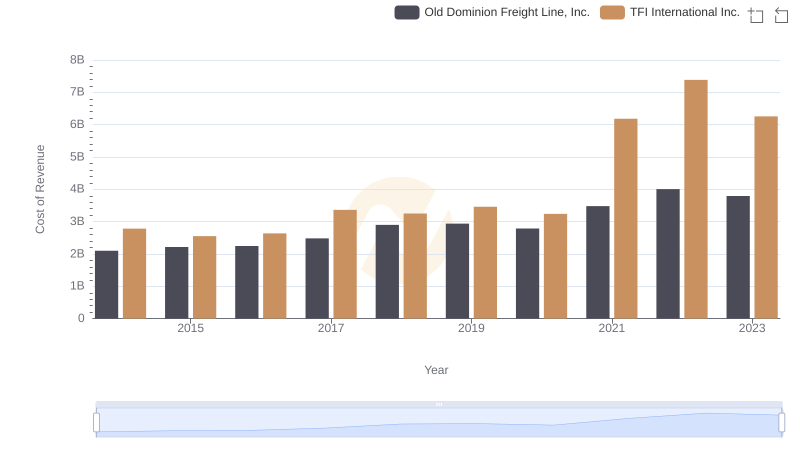
Cost of Revenue: Key Insights for Old Dominion Freight Line, Inc. and TFI International Inc.
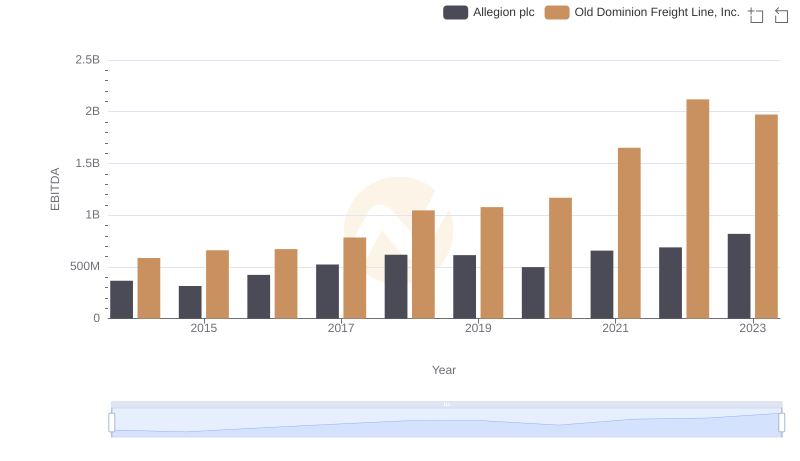
A Side-by-Side Analysis of EBITDA: Old Dominion Freight Line, Inc. and Allegion plc