| __timestamp | Gen Digital Inc. | Infosys Limited |
|---|---|---|
| Wednesday, January 1, 2014 | 1149000000 | 5374000000 |
| Thursday, January 1, 2015 | 1153000000 | 5950000000 |
| Friday, January 1, 2016 | 615000000 | 6446000000 |
| Sunday, January 1, 2017 | 853000000 | 7001000000 |
| Monday, January 1, 2018 | 1032000000 | 7687000000 |
| Tuesday, January 1, 2019 | 1050000000 | 8552000000 |
| Wednesday, January 1, 2020 | 393000000 | 8828000000 |
| Friday, January 1, 2021 | 362000000 | 10996000000 |
| Saturday, January 1, 2022 | 408000000 | 12709000000 |
| Sunday, January 1, 2023 | 589000000 | 13096000000 |
| Monday, January 1, 2024 | 731000000 |
Unveiling the hidden dimensions of data
In the ever-evolving landscape of global technology, Infosys Limited and Gen Digital Inc. stand as titans, each with its unique trajectory. Over the past decade, Infosys has consistently demonstrated robust growth, with its cost of revenue surging by approximately 144% from 2014 to 2023. This reflects the company's expanding operations and increasing market demand. In contrast, Gen Digital Inc. experienced a more volatile journey, with its cost of revenue peaking in 2015 and then dipping significantly by 2020, before showing signs of recovery in recent years.
The data reveals a fascinating narrative of resilience and adaptation. While Infosys's steady climb underscores its strategic prowess, Gen Digital's fluctuations highlight the challenges and opportunities in the digital realm. As we look to the future, these trends offer valuable insights into the competitive dynamics of the tech industry.
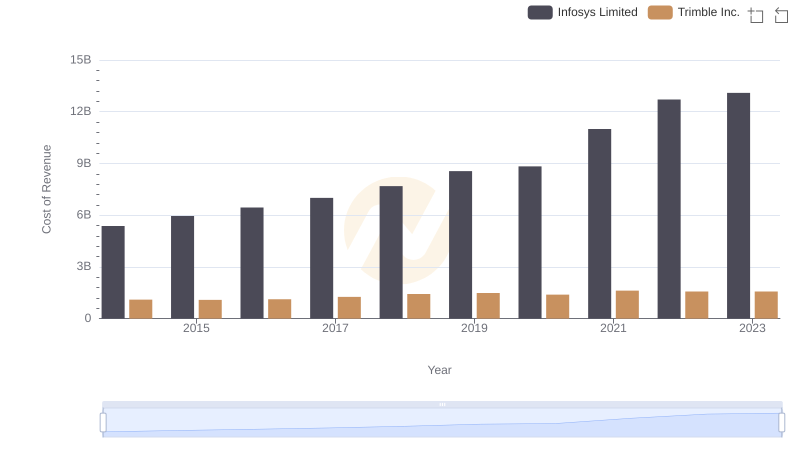
Infosys Limited vs Trimble Inc.: Efficiency in Cost of Revenue Explored
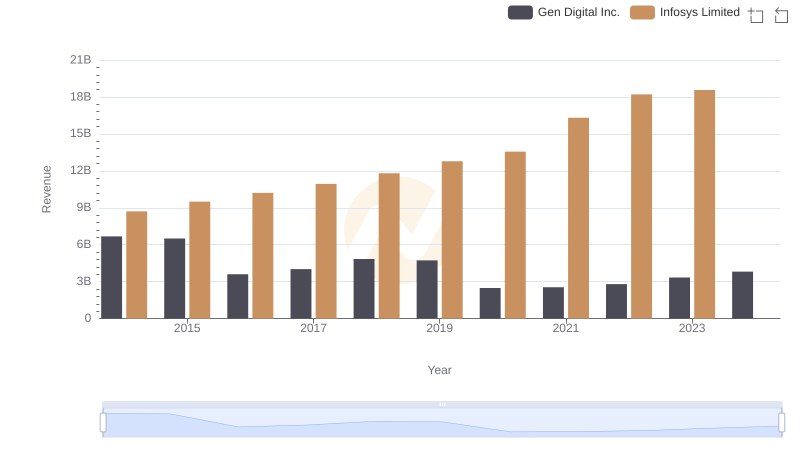
Annual Revenue Comparison: Infosys Limited vs Gen Digital Inc.
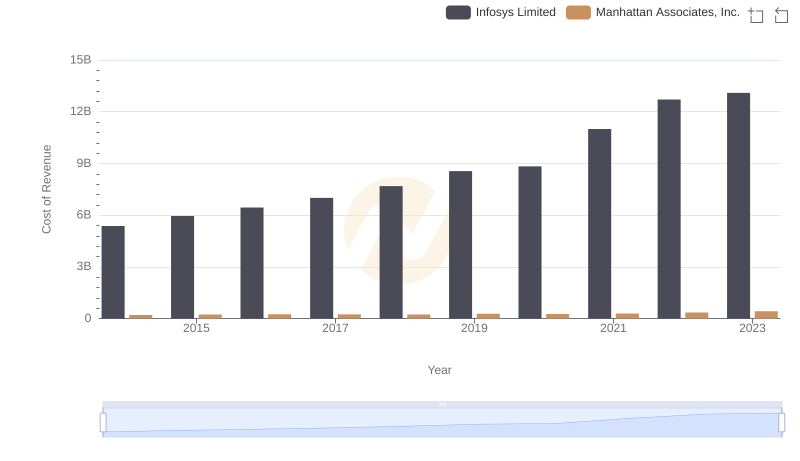
Cost of Revenue Trends: Infosys Limited vs Manhattan Associates, Inc.
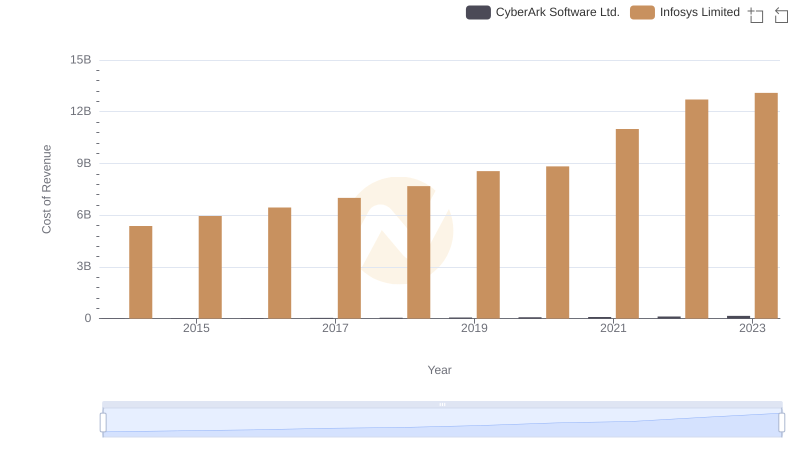
Cost of Revenue: Key Insights for Infosys Limited and CyberArk Software Ltd.
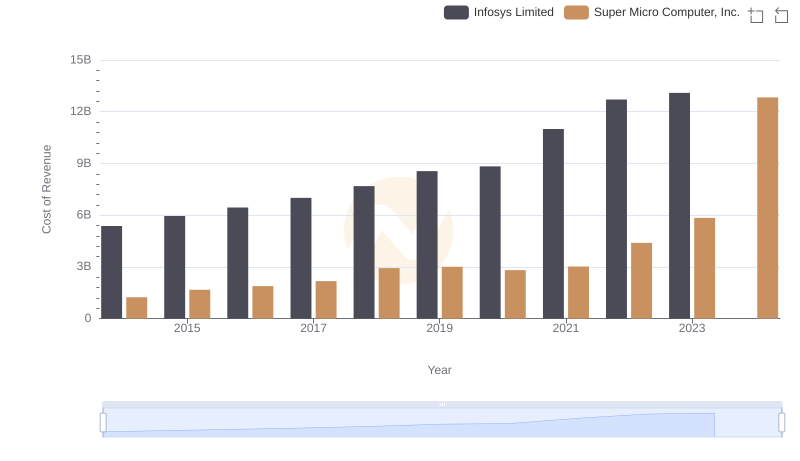
Cost Insights: Breaking Down Infosys Limited and Super Micro Computer, Inc.'s Expenses
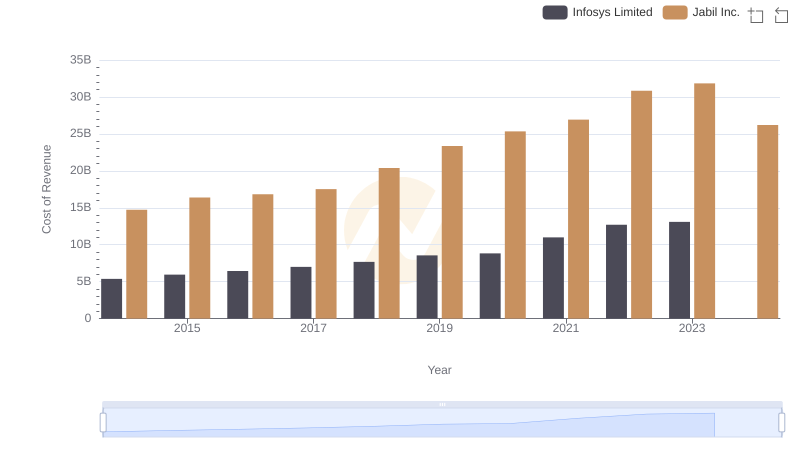
Cost of Revenue: Key Insights for Infosys Limited and Jabil Inc.
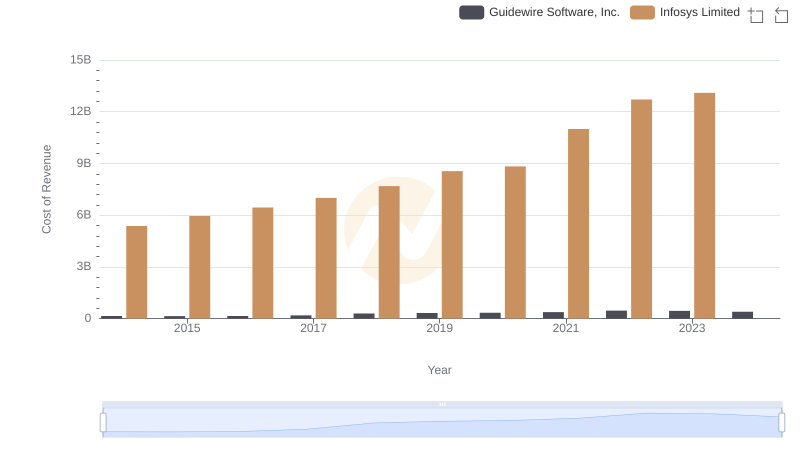
Comparing Cost of Revenue Efficiency: Infosys Limited vs Guidewire Software, Inc.
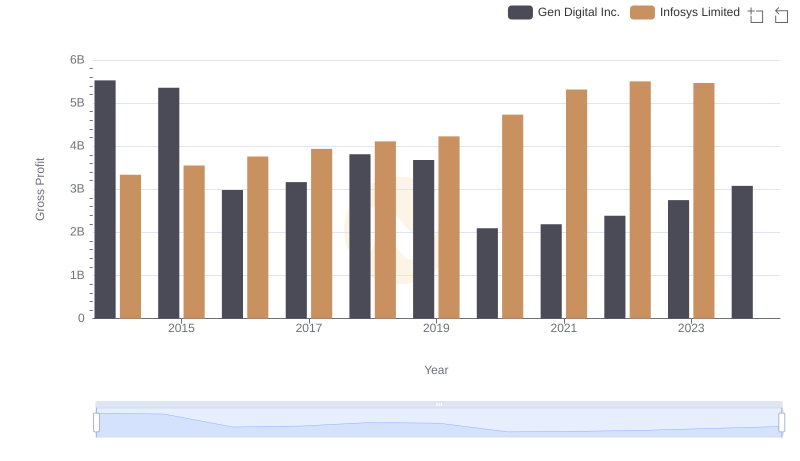
Infosys Limited vs Gen Digital Inc.: A Gross Profit Performance Breakdown
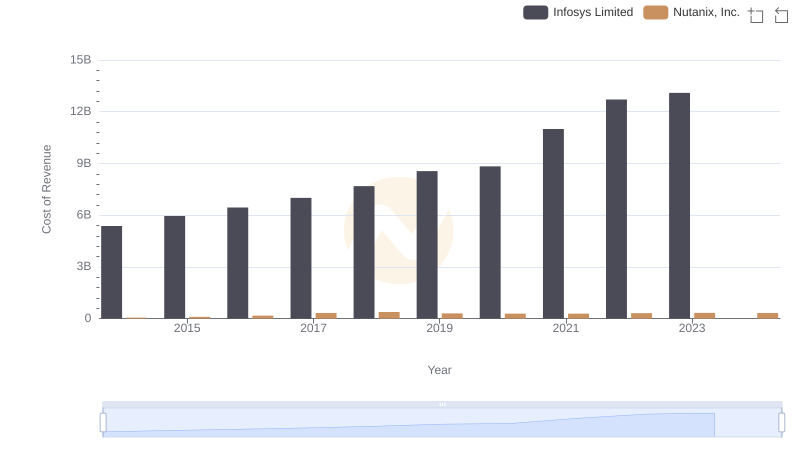
Infosys Limited vs Nutanix, Inc.: Efficiency in Cost of Revenue Explored
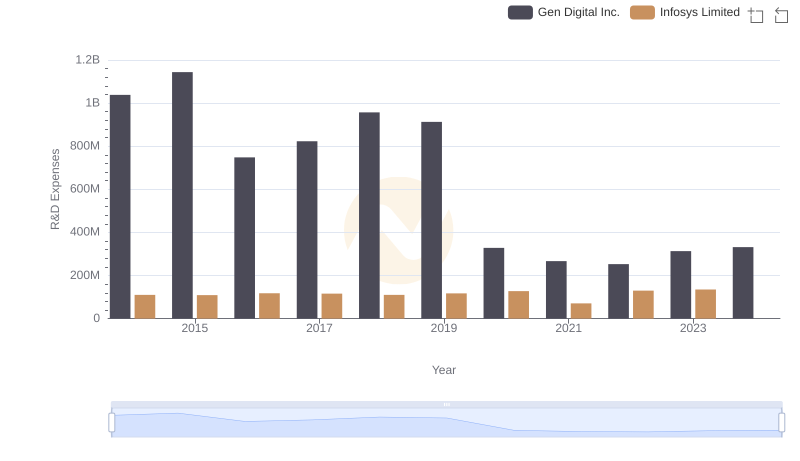
Comparing Innovation Spending: Infosys Limited and Gen Digital Inc.
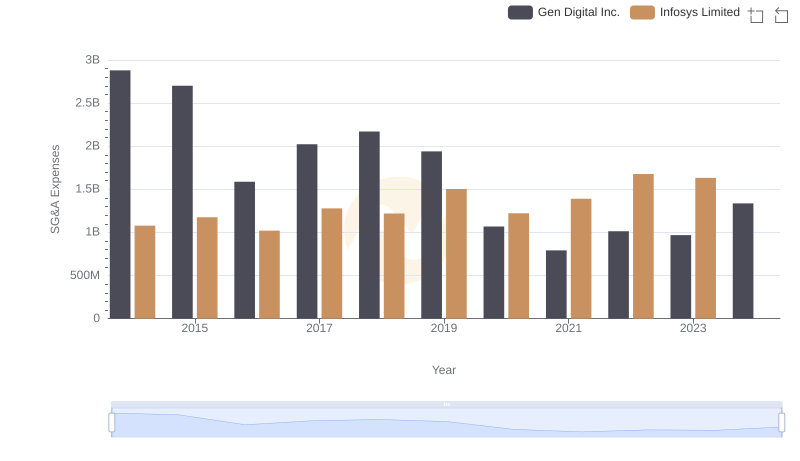
Who Optimizes SG&A Costs Better? Infosys Limited or Gen Digital Inc.
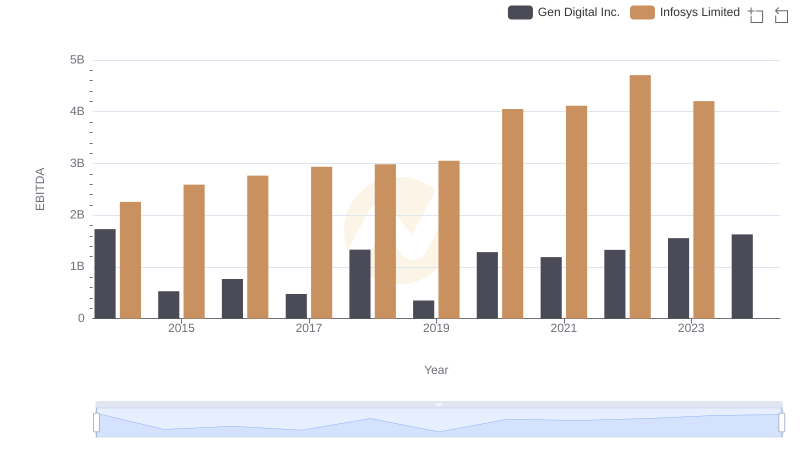
A Side-by-Side Analysis of EBITDA: Infosys Limited and Gen Digital Inc.