| __timestamp | Automatic Data Processing, Inc. | Rentokil Initial plc |
|---|---|---|
| Wednesday, January 1, 2014 | 2616900000 | 410400000 |
| Thursday, January 1, 2015 | 2355100000 | 408700000 |
| Friday, January 1, 2016 | 2579500000 | 489000000 |
| Sunday, January 1, 2017 | 2927200000 | 503200000 |
| Monday, January 1, 2018 | 2762900000 | 149800000 |
| Tuesday, January 1, 2019 | 3544500000 | 580600000 |
| Wednesday, January 1, 2020 | 3769700000 | 581000000 |
| Friday, January 1, 2021 | 3931600000 | 656000000 |
| Saturday, January 1, 2022 | 4405500000 | 767000000 |
| Sunday, January 1, 2023 | 5244600000 | 1157000000 |
| Monday, January 1, 2024 | 5800000000 |
Unleashing the power of data
In the ever-evolving landscape of global business, understanding the financial health of industry giants is crucial. This analysis delves into the EBITDA performance of Automatic Data Processing, Inc. (ADP) and Rentokil Initial plc from 2014 to 2023. Over this period, ADP has demonstrated a robust growth trajectory, with its EBITDA increasing by approximately 122%, from $2.6 billion in 2014 to an impressive $5.8 billion in 2023. In contrast, Rentokil's EBITDA, while showing a steady upward trend, grew by about 182%, reaching $1.16 billion in 2023. This stark difference highlights ADP's dominant market position, yet Rentokil's rapid growth rate is noteworthy. The data for 2024 remains incomplete, offering a tantalizing glimpse into future financial landscapes. This side-by-side analysis provides valuable insights for investors and industry analysts alike, emphasizing the dynamic nature of corporate financial performance.
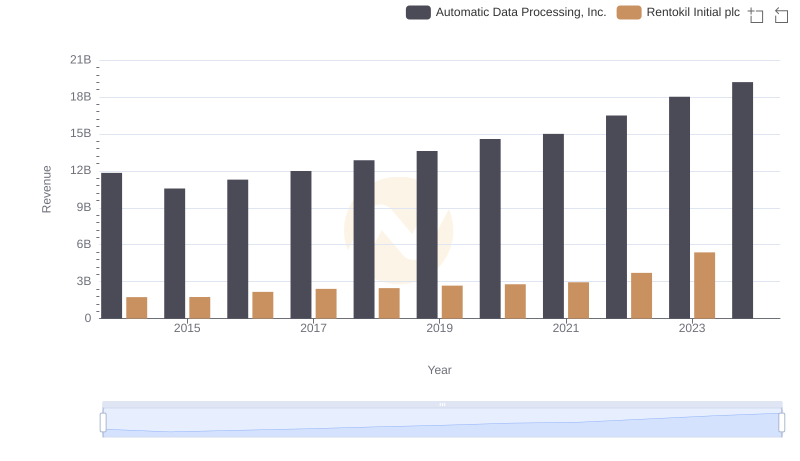
Annual Revenue Comparison: Automatic Data Processing, Inc. vs Rentokil Initial plc
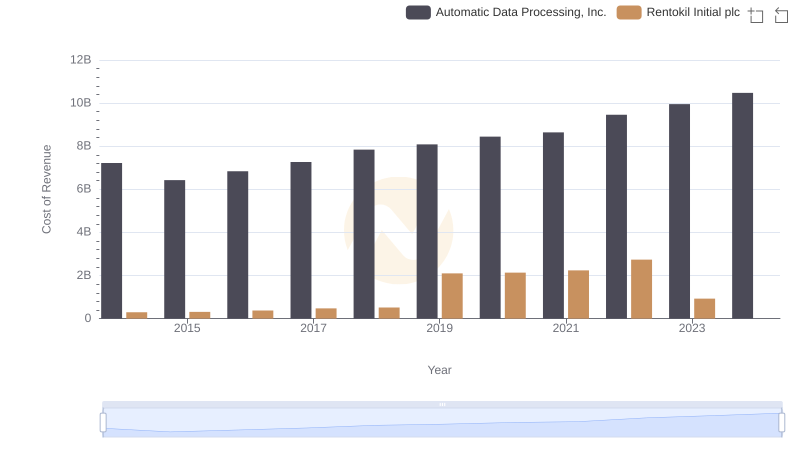
Cost of Revenue Comparison: Automatic Data Processing, Inc. vs Rentokil Initial plc
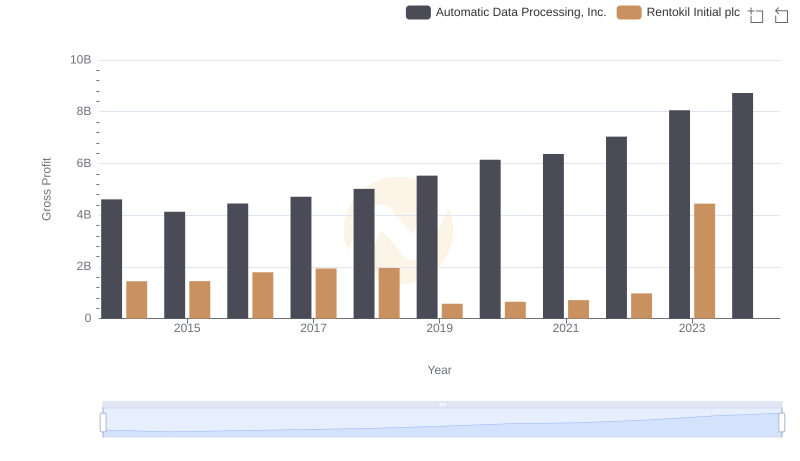
Who Generates Higher Gross Profit? Automatic Data Processing, Inc. or Rentokil Initial plc

A Professional Review of EBITDA: Automatic Data Processing, Inc. Compared to U-Haul Holding Company

Comprehensive EBITDA Comparison: Automatic Data Processing, Inc. vs Elbit Systems Ltd.

Automatic Data Processing, Inc. vs Nordson Corporation: In-Depth EBITDA Performance Comparison
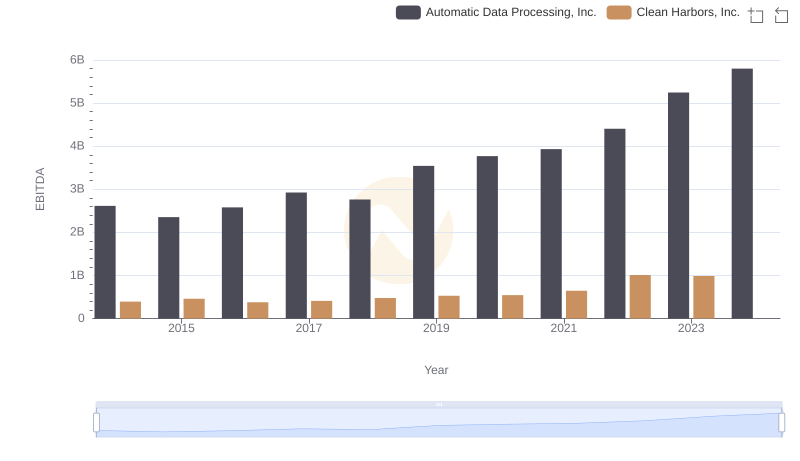
EBITDA Performance Review: Automatic Data Processing, Inc. vs Clean Harbors, Inc.
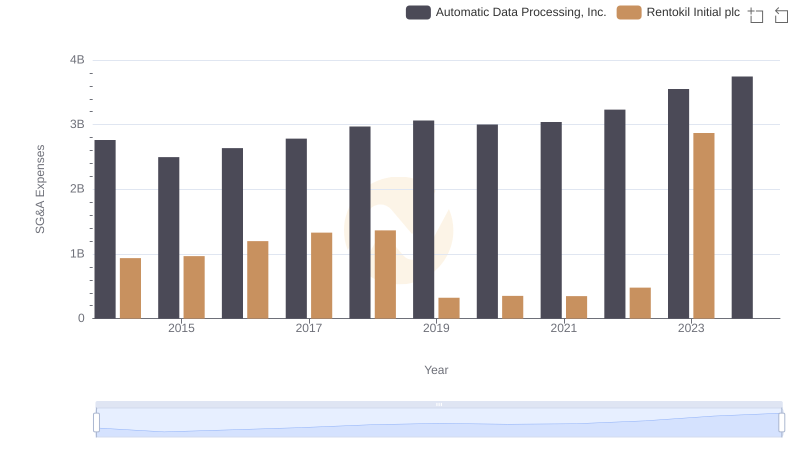
Operational Costs Compared: SG&A Analysis of Automatic Data Processing, Inc. and Rentokil Initial plc
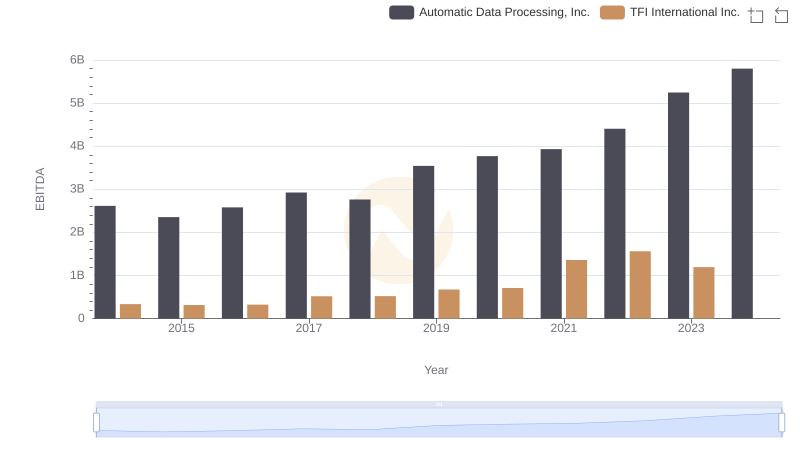
Automatic Data Processing, Inc. vs TFI International Inc.: In-Depth EBITDA Performance Comparison

EBITDA Performance Review: Automatic Data Processing, Inc. vs ITT Inc.