| __timestamp | Automatic Data Processing, Inc. | Rentokil Initial plc |
|---|---|---|
| Wednesday, January 1, 2014 | 7221400000 | 297500000 |
| Thursday, January 1, 2015 | 6427600000 | 310200000 |
| Friday, January 1, 2016 | 6840300000 | 376100000 |
| Sunday, January 1, 2017 | 7269800000 | 474900000 |
| Monday, January 1, 2018 | 7842600000 | 514200000 |
| Tuesday, January 1, 2019 | 8086600000 | 2099000000 |
| Wednesday, January 1, 2020 | 8445100000 | 2136400000 |
| Friday, January 1, 2021 | 8640300000 | 2239100000 |
| Saturday, January 1, 2022 | 9461900000 | 2737000000 |
| Sunday, January 1, 2023 | 9953400000 | 927000000 |
| Monday, January 1, 2024 | 10476700000 |
Data in motion
In the world of business, understanding the cost of revenue is crucial for evaluating a company's efficiency. This chart compares the cost of revenue for Automatic Data Processing, Inc. (ADP) and Rentokil Initial plc from 2014 to 2023. ADP, a leader in human resources management, consistently shows a higher cost of revenue, peaking at approximately $10.5 billion in 2024. This represents a 45% increase from 2014. Meanwhile, Rentokil, a global pest control company, saw its cost of revenue rise by over 800% from 2014 to 2022, reaching nearly $2.7 billion. However, 2023 saw a significant drop to $927 million, indicating potential operational shifts or market changes. The data highlights the contrasting scales and growth trajectories of these two industry leaders, offering insights into their strategic priorities and market dynamics.
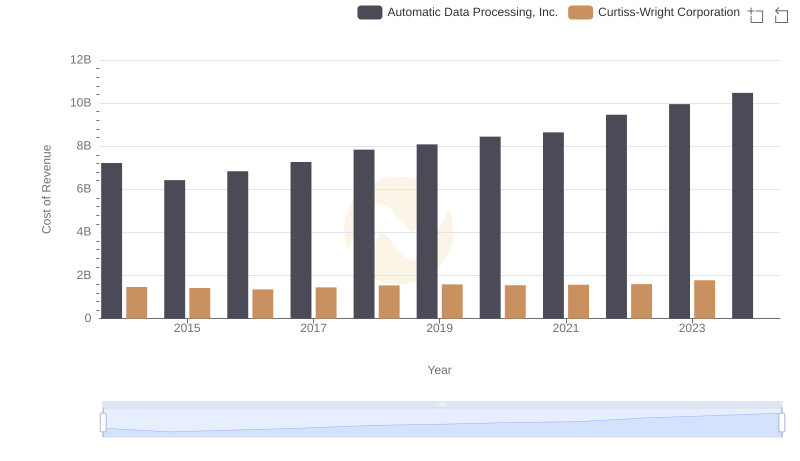
Comparing Cost of Revenue Efficiency: Automatic Data Processing, Inc. vs Curtiss-Wright Corporation
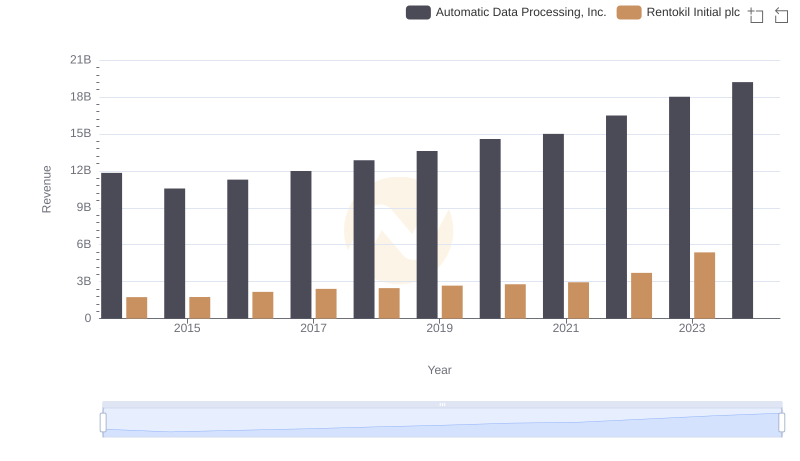
Annual Revenue Comparison: Automatic Data Processing, Inc. vs Rentokil Initial plc
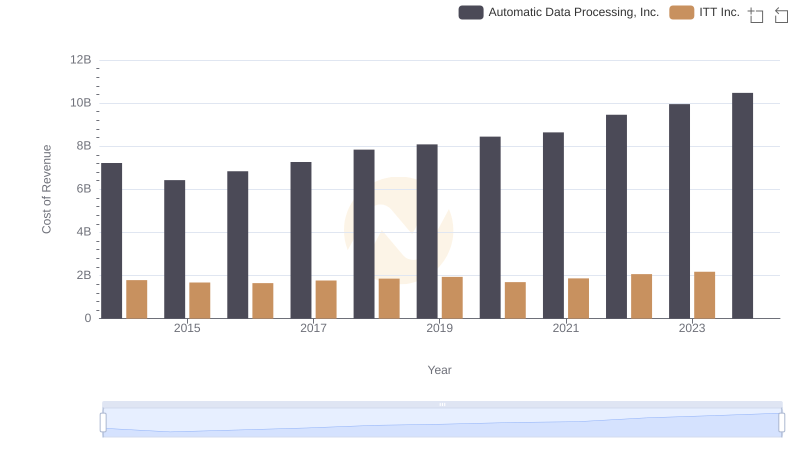
Comparing Cost of Revenue Efficiency: Automatic Data Processing, Inc. vs ITT Inc.
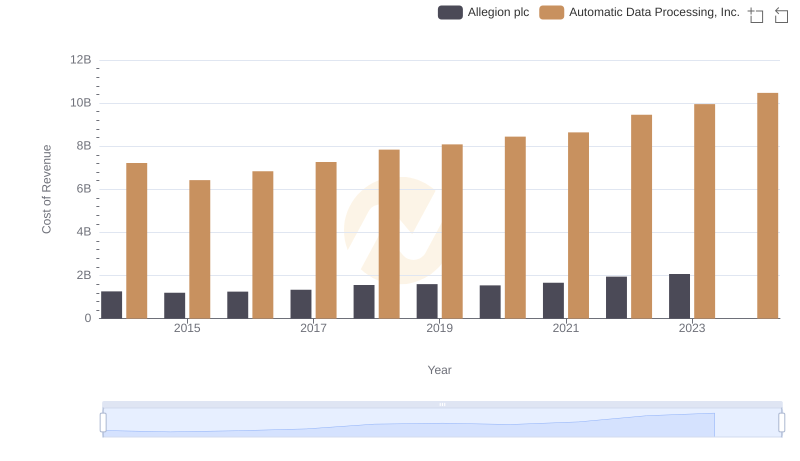
Comparing Cost of Revenue Efficiency: Automatic Data Processing, Inc. vs Allegion plc
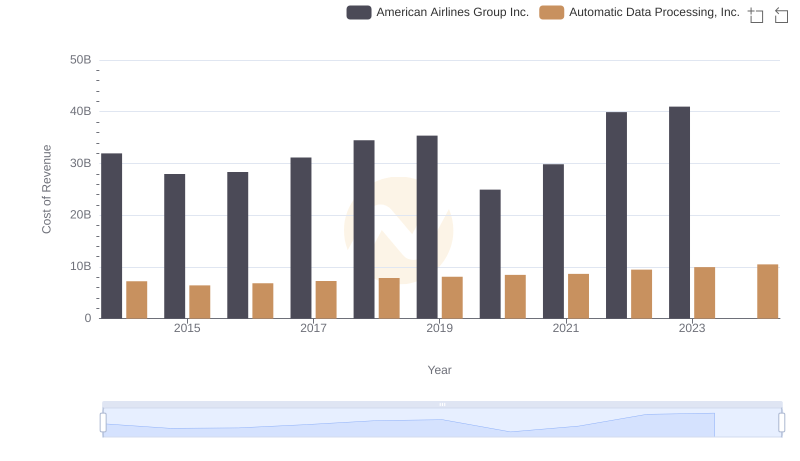
Analyzing Cost of Revenue: Automatic Data Processing, Inc. and American Airlines Group Inc.
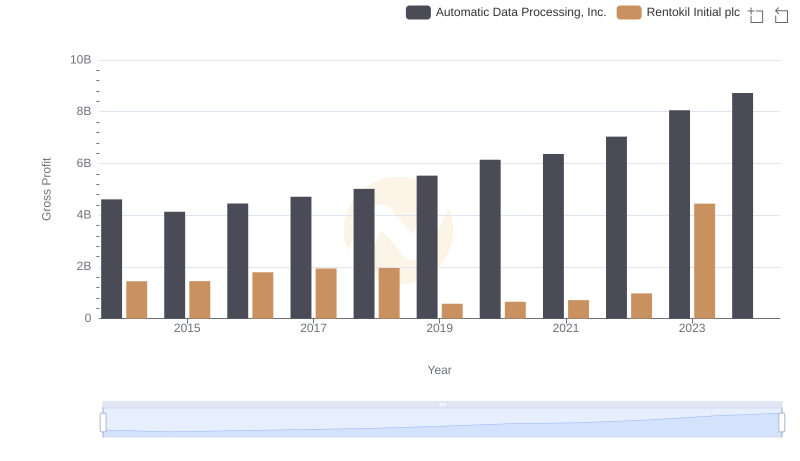
Who Generates Higher Gross Profit? Automatic Data Processing, Inc. or Rentokil Initial plc
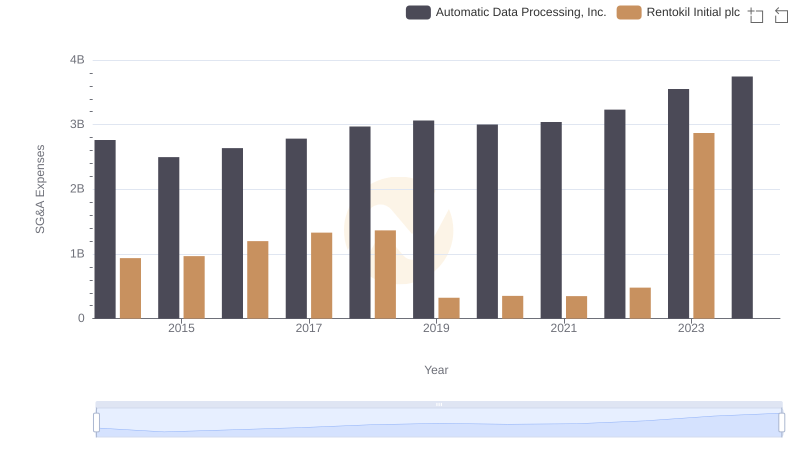
Operational Costs Compared: SG&A Analysis of Automatic Data Processing, Inc. and Rentokil Initial plc
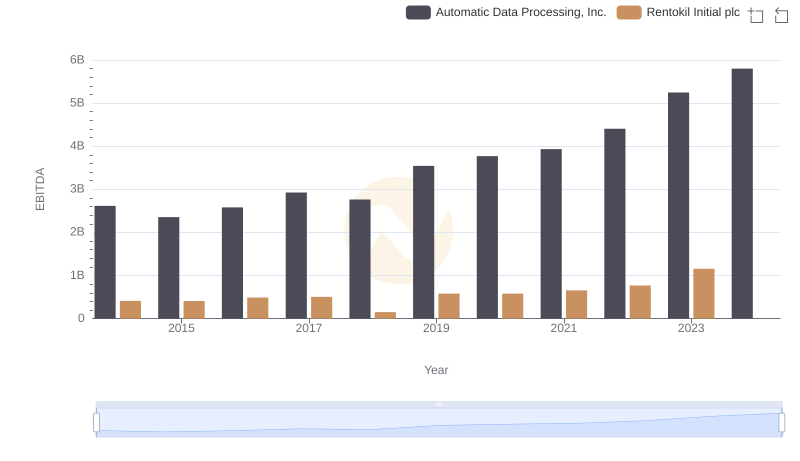
A Side-by-Side Analysis of EBITDA: Automatic Data Processing, Inc. and Rentokil Initial plc